OPEN-SOURCE SCRIPT
Zaktualizowano RSI Return Study
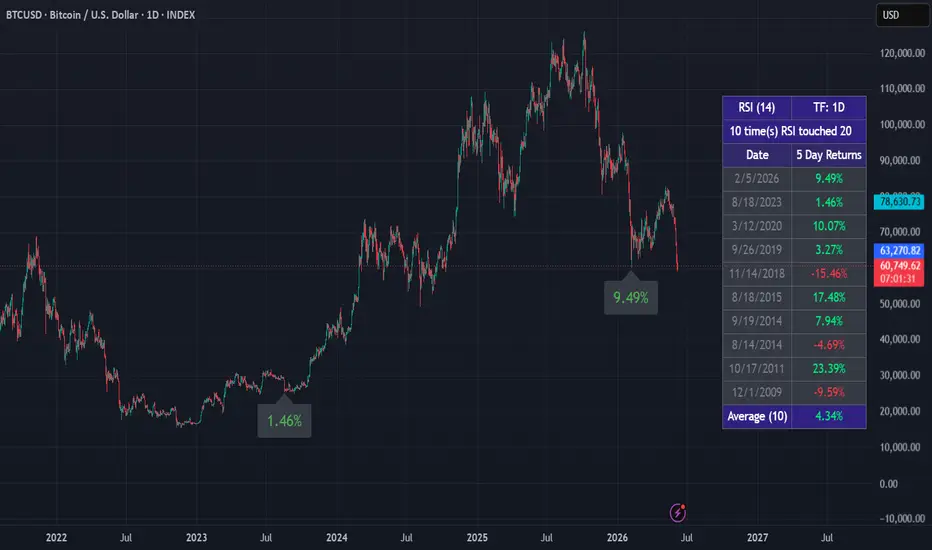
Ever wonder what happens after the RSI hits an extreme level on your favorite ticker? This indicator answers that question historically.
What it does:
How to use:
Notes:
What it does:
- Finds every instance where the RSI crossed a user-defined trigger level
- Measures the forward price return N trading days later
- Displays each signal date and return in a clean table
- Plots labels on the chart at each signal location
- Shows the average return across all historical signals
How to use:
- Set "When RSI Touches..." to your oversold level (e.g. 25) or overbought level (e.g. 75)
- Set "Calculate Return Days Later" to how many trading days forward you want to measure
- Works on any timeframe — bar count is automatically calculated for you
- Adjust "Max Results/Labels to Display" to control how much shows on the chart
Notes:
- All signals are included in the average regardless of the display limit
- Set "Min Bars Between Signals" to 0 to count every RSI cross, or increase it to reduce clustering during volatile periods
Informacje o Wersji
Added the ability to see more than one forward return. For example, can now input"1D,3D,7D" or
"5D,1M,3M,6M,1Y"
Can support up to 5 forward returns.
Skrypt open-source
W zgodzie z duchem TradingView twórca tego skryptu udostępnił go jako open-source, aby użytkownicy mogli przejrzeć i zweryfikować jego działanie. Ukłony dla autora. Korzystanie jest bezpłatne, jednak ponowna publikacja kodu podlega naszym Zasadom serwisu.

Wyłączenie odpowiedzialności
Informacje i publikacje nie stanowią i nie powinny być traktowane jako porady finansowe, inwestycyjne, tradingowe ani jakiekolwiek inne rekomendacje dostarczane lub zatwierdzone przez TradingView. Więcej informacji znajduje się w Warunkach użytkowania.
Skrypt open-source
W zgodzie z duchem TradingView twórca tego skryptu udostępnił go jako open-source, aby użytkownicy mogli przejrzeć i zweryfikować jego działanie. Ukłony dla autora. Korzystanie jest bezpłatne, jednak ponowna publikacja kodu podlega naszym Zasadom serwisu.
Wyłączenie odpowiedzialności
Informacje i publikacje nie stanowią i nie powinny być traktowane jako porady finansowe, inwestycyjne, tradingowe ani jakiekolwiek inne rekomendacje dostarczane lub zatwierdzone przez TradingView. Więcej informacji znajduje się w Warunkach użytkowania.