EMA/MA Toolkit
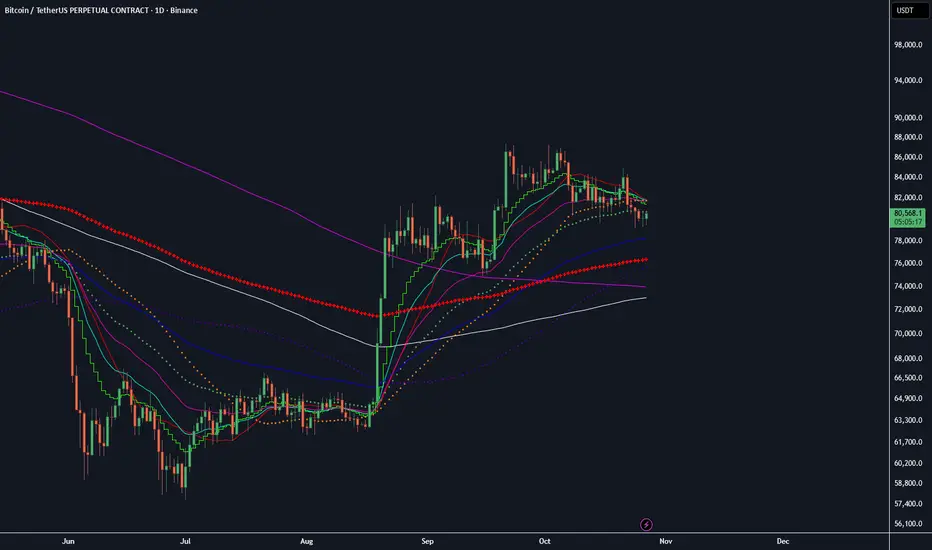
EMA & MA Calculations
The toolkit combines 11 independently configurable moving averages.
Simple Moving Averages (SMA)
- MA20, MA50, MA100, MA200, MA300
- Calculated using the arithmetic mean of the selected price source over the specified number of periods.
- Primarily used to evaluate intermediate and long-term trend direction and potential dynamic support and resistance.
Exponential Moving Averages (EMA)
- EMA13, EMA21, EMA34, EMA50, EMA89, EMA200
- Calculated using standard exponential smoothing, with a weighting multiplier of 2 / (length + 1).
- More recent prices receive greater weight, allowing these averages to react more quickly to price changes than simple moving averages of equivalent length.
The shorter-period EMAs help visualize momentum changes, while the longer-period EMAs provide additional context for broader trend direction.
All averages are calculated using the selected price source and the chart's active timeframe. Individual periods, sources, and plotting styles can be customized through the indicator settings.
The toolkit also provides separate visibility controls for the SMA and EMA groups.
The toolkit combines 11 independently configurable moving averages.
Simple Moving Averages (SMA)
- MA20, MA50, MA100, MA200, MA300
- Calculated using the arithmetic mean of the selected price source over the specified number of periods.
- Primarily used to evaluate intermediate and long-term trend direction and potential dynamic support and resistance.
Exponential Moving Averages (EMA)
- EMA13, EMA21, EMA34, EMA50, EMA89, EMA200
- Calculated using standard exponential smoothing, with a weighting multiplier of 2 / (length + 1).
- More recent prices receive greater weight, allowing these averages to react more quickly to price changes than simple moving averages of equivalent length.
The shorter-period EMAs help visualize momentum changes, while the longer-period EMAs provide additional context for broader trend direction.
All averages are calculated using the selected price source and the chart's active timeframe. Individual periods, sources, and plotting styles can be customized through the indicator settings.
The toolkit also provides separate visibility controls for the SMA and EMA groups.

Wyłączenie odpowiedzialności
Informacje i publikacje nie stanowią i nie powinny być traktowane jako porady finansowe, inwestycyjne, tradingowe ani jakiekolwiek inne rekomendacje dostarczane lub zatwierdzone przez TradingView. Więcej informacji znajduje się w Warunkach użytkowania.
Wyłączenie odpowiedzialności
Informacje i publikacje nie stanowią i nie powinny być traktowane jako porady finansowe, inwestycyjne, tradingowe ani jakiekolwiek inne rekomendacje dostarczane lub zatwierdzone przez TradingView. Więcej informacji znajduje się w Warunkach użytkowania.