OPEN-SOURCE SCRIPT
Futrues Daily Pivot Zones
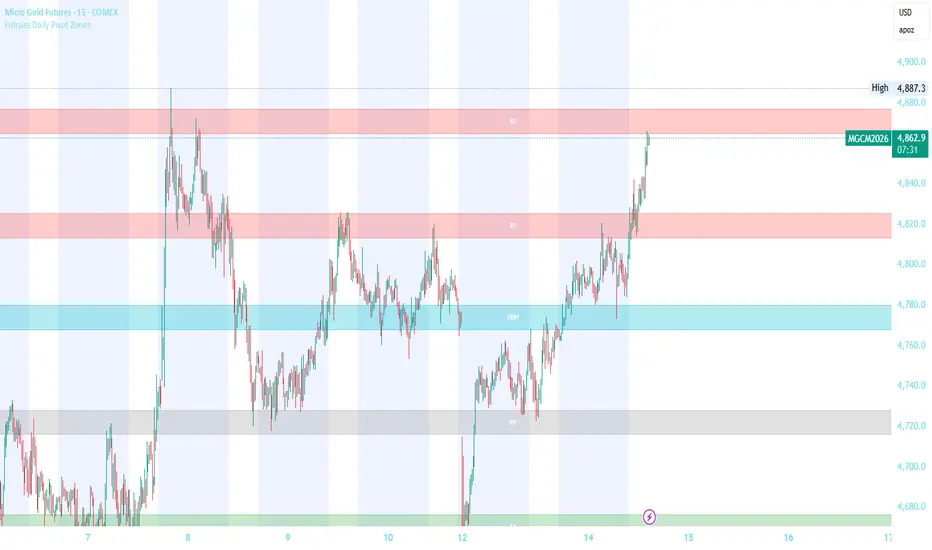
Automatically plots Daily Pivot Point levels as clean rectangle zones directly on your futures chart. Levels are calculated from the previous day's High, Low, and Close — the same levels watched by institutions, banks, and algorithms every single session.
Levels Included:
PP — Main Pivot Point (most watched level of the day)
R1, R2, R3 — Resistance zones above PP
S1, S2, S3 — Support zones below PP
PDH — Previous Day High
PDL — Previous Day Low
How To Use:
Look for price to reject or bounce off a zone in confluence with your EMA bias and VWAP direction. The more factors that agree at a zone — the stronger the trade.
Recommended Zone Buffer By Instrument:
MES (Micro E-Mini S&P 500) → 4.0 - 5.0 points
MNQ (Micro E-Mini Nasdaq) → 8.0 - 10.0 points
MGC (Micro Gold) → 15.0 - 20.0 points
MCL (Micro Crude Oil) → 0.15 - 0.25 points
M2K (Micro Russell 2000) → 3.0 - 4.0 points
Recommended Lookback:
750 bars on a 15-min chart covers approximately 3 trading days of price action.
Levels Included:
PP — Main Pivot Point (most watched level of the day)
R1, R2, R3 — Resistance zones above PP
S1, S2, S3 — Support zones below PP
PDH — Previous Day High
PDL — Previous Day Low
How To Use:
Look for price to reject or bounce off a zone in confluence with your EMA bias and VWAP direction. The more factors that agree at a zone — the stronger the trade.
Recommended Zone Buffer By Instrument:
MES (Micro E-Mini S&P 500) → 4.0 - 5.0 points
MNQ (Micro E-Mini Nasdaq) → 8.0 - 10.0 points
MGC (Micro Gold) → 15.0 - 20.0 points
MCL (Micro Crude Oil) → 0.15 - 0.25 points
M2K (Micro Russell 2000) → 3.0 - 4.0 points
Recommended Lookback:
750 bars on a 15-min chart covers approximately 3 trading days of price action.
Skrypt open-source
W zgodzie z duchem TradingView twórca tego skryptu udostępnił go jako open-source, aby użytkownicy mogli przejrzeć i zweryfikować jego działanie. Ukłony dla autora. Korzystanie jest bezpłatne, jednak ponowna publikacja kodu podlega naszym Zasadom serwisu.

Wyłączenie odpowiedzialności
Informacje i publikacje nie stanowią i nie powinny być traktowane jako porady finansowe, inwestycyjne, tradingowe ani jakiekolwiek inne rekomendacje dostarczane lub zatwierdzone przez TradingView. Więcej informacji znajduje się w Warunkach użytkowania.
Skrypt open-source
W zgodzie z duchem TradingView twórca tego skryptu udostępnił go jako open-source, aby użytkownicy mogli przejrzeć i zweryfikować jego działanie. Ukłony dla autora. Korzystanie jest bezpłatne, jednak ponowna publikacja kodu podlega naszym Zasadom serwisu.
Wyłączenie odpowiedzialności
Informacje i publikacje nie stanowią i nie powinny być traktowane jako porady finansowe, inwestycyjne, tradingowe ani jakiekolwiek inne rekomendacje dostarczane lub zatwierdzone przez TradingView. Więcej informacji znajduje się w Warunkach użytkowania.