ATK/DEF Power Swing -HP Minor Swing Point
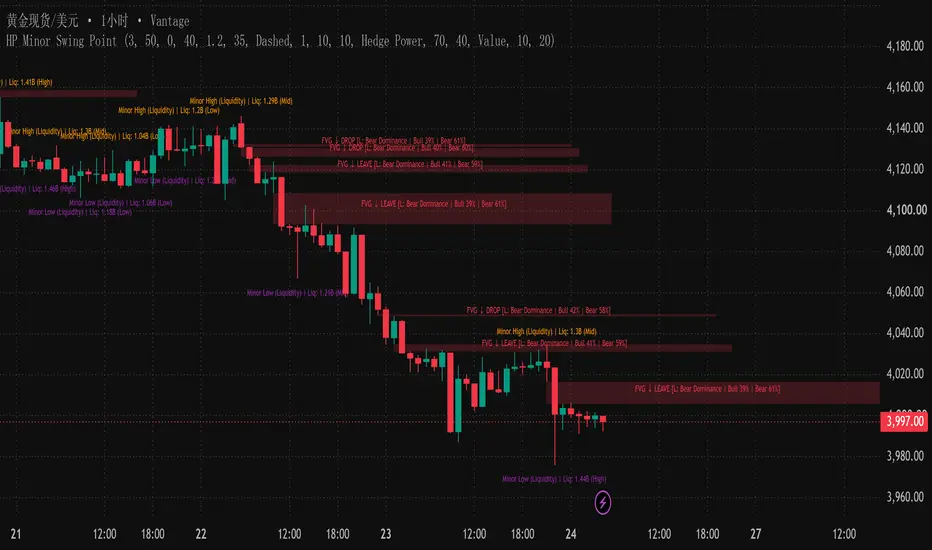
# ATK/DEF Power Swing -HP Minor Swing Point
## Overview
**ATK/DEF Power Swing -HP Minor Swing Point** is a market structure analysis indicator focused on Minor Swing Points, HP-based movement classification, liquidity activity measurement, BOS/CHoCH structure events, and Fair Value Gap (FVG) lifecycle tracking.
The indicator combines several analytical components into one chart-based framework, allowing users to observe minor structural changes, compare relative activity, and follow the development of price gaps over time.
## Key Features
### 1. Minor Swing Structure
- Identifies Minor Swing Highs and Minor Swing Lows using pivot-based calculations.
- Displays swing-point labels to make local structural changes easier to observe.
- Provides the reference points used by the structure-break module.
### 2. HP Analysis
- Supports **Hedge Power**, **Hidden Power**, and **Hybrid Power** modes.
- Calculates a rule-based HP score from directional volume and candle-body information across a defined swing interval.
- Optionally displays scores and strength grades using configurable thresholds.
- Classifies selected movement patterns, including Real Accumulation, Fake Distribution, Hidden Accumulation/Distribution, and Hybrid Bull/Bear.
These classifications represent the indicator's calculation rules and should not be interpreted as verified institutional activity or statistical probabilities.
### 3. Minor Liquidity Activity
- Measures activity around minor swing points.
- Supports three calculation modes: **Volume**, **Value**, and **Volatility**.
- Compares measured activity against a historical sample to assign relative High, Mid, or Low grades when sufficient samples are available.
These measurements are analytical proxies derived from chart data; they do not represent a direct measurement of total market liquidity.
### 4. BOS / CHoCH Structure Events
- Detects structure breaks using candle-close confirmation against stored swing levels.
- Distinguishes BOS and CHoCH events according to the script's internal structure state.
- Supports optional horizontal break lines and directional event labels.
### 5. FVG Lifecycle Analysis
- Detects bullish and bearish Fair Value Gaps using a three-candle price-gap condition.
- Tracks the development of each gap through a four-stage process:
- **Bullish:** CLIMB → INSIDE → LEAVE / STOP
- **Bearish:** DROP → INSIDE → LEAVE / STOP
- Tracks candle-direction-based volume composition within FVG zones.
- Displays relative volume percentages and dominance classifications according to the configured threshold.
- Manages gap objects as price interacts with their boundaries.
The volume composition is derived from candle direction and available chart volume. It is not direct exchange-level transaction-flow data.
## Chart Examples
**Example 1**

**Example 2**

**Example 3**

**Example 4**

## Intended Use
This indicator is designed for **market structure observation and analytical visualization**. It brings minor swing structure, HP classifications, relative activity measurements, BOS/CHoCH events, and FVG lifecycle information together in a unified chart layout.
## Overview
**ATK/DEF Power Swing -HP Minor Swing Point** is a market structure analysis indicator focused on Minor Swing Points, HP-based movement classification, liquidity activity measurement, BOS/CHoCH structure events, and Fair Value Gap (FVG) lifecycle tracking.
The indicator combines several analytical components into one chart-based framework, allowing users to observe minor structural changes, compare relative activity, and follow the development of price gaps over time.
## Key Features
### 1. Minor Swing Structure
- Identifies Minor Swing Highs and Minor Swing Lows using pivot-based calculations.
- Displays swing-point labels to make local structural changes easier to observe.
- Provides the reference points used by the structure-break module.
### 2. HP Analysis
- Supports **Hedge Power**, **Hidden Power**, and **Hybrid Power** modes.
- Calculates a rule-based HP score from directional volume and candle-body information across a defined swing interval.
- Optionally displays scores and strength grades using configurable thresholds.
- Classifies selected movement patterns, including Real Accumulation, Fake Distribution, Hidden Accumulation/Distribution, and Hybrid Bull/Bear.
These classifications represent the indicator's calculation rules and should not be interpreted as verified institutional activity or statistical probabilities.
### 3. Minor Liquidity Activity
- Measures activity around minor swing points.
- Supports three calculation modes: **Volume**, **Value**, and **Volatility**.
- Compares measured activity against a historical sample to assign relative High, Mid, or Low grades when sufficient samples are available.
These measurements are analytical proxies derived from chart data; they do not represent a direct measurement of total market liquidity.
### 4. BOS / CHoCH Structure Events
- Detects structure breaks using candle-close confirmation against stored swing levels.
- Distinguishes BOS and CHoCH events according to the script's internal structure state.
- Supports optional horizontal break lines and directional event labels.
### 5. FVG Lifecycle Analysis
- Detects bullish and bearish Fair Value Gaps using a three-candle price-gap condition.
- Tracks the development of each gap through a four-stage process:
- **Bullish:** CLIMB → INSIDE → LEAVE / STOP
- **Bearish:** DROP → INSIDE → LEAVE / STOP
- Tracks candle-direction-based volume composition within FVG zones.
- Displays relative volume percentages and dominance classifications according to the configured threshold.
- Manages gap objects as price interacts with their boundaries.
The volume composition is derived from candle direction and available chart volume. It is not direct exchange-level transaction-flow data.
## Chart Examples
**Example 1**
**Example 2**
**Example 3**
**Example 4**
## Intended Use
This indicator is designed for **market structure observation and analytical visualization**. It brings minor swing structure, HP classifications, relative activity measurements, BOS/CHoCH events, and FVG lifecycle information together in a unified chart layout.

Wyłączenie odpowiedzialności
Informacje i publikacje nie stanowią i nie powinny być traktowane jako porady finansowe, inwestycyjne, tradingowe ani jakiekolwiek inne rekomendacje dostarczane lub zatwierdzone przez TradingView. Więcej informacji znajduje się w Warunkach użytkowania.
Wyłączenie odpowiedzialności
Informacje i publikacje nie stanowią i nie powinny być traktowane jako porady finansowe, inwestycyjne, tradingowe ani jakiekolwiek inne rekomendacje dostarczane lub zatwierdzone przez TradingView. Więcej informacji znajduje się w Warunkach użytkowania.