Zaktualizowano
Flat Candle + True Gap v2
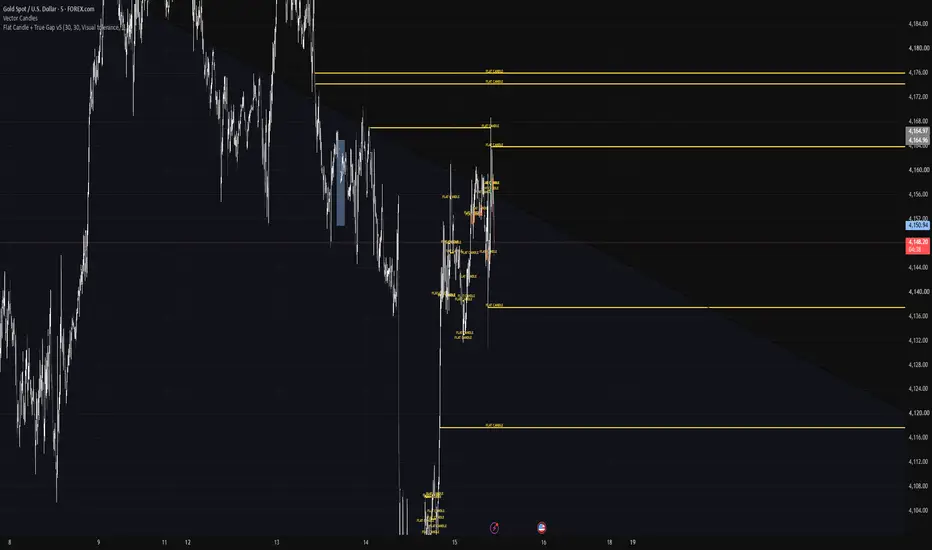
**Flat Candle + True Gap**
This indicator is designed to identify and display two simple price-action elements: **Flat Candles** and **True Gaps**.
A **Flat Candle** is defined as a candle with no wick on one side:
- No upper wick → a horizontal line is drawn from the candle's high.
- No lower wick → a horizontal line is drawn from the candle's low.
- If both sides are flat, both levels are displayed.
Each Flat Candle level extends to the right until a future candle touches it. When the level is touched, the line can either stop at the touching candle and remain visible as historical reference, or be removed completely, depending on the selected setting.
A **True Gap** is a real price gap between two consecutive candles:
- Bullish True Gap: the current candle's low is above the previous candle's high.
- Bearish True Gap: the current candle's high is below the previous candle's low.
The indicator draws a band covering the exact untraded price area between the two candles. The band extends to the right until price touches any part of the gap. Once touched, the band can remain on the chart and stop at the mitigation candle, or disappear completely.
### Features
- Detects upper and lower Flat Candle levels
- Detects bullish and bearish True Gaps
- Flat Candle lines begin directly from the originating candle
- True Gap bands cover only the actual gap area
- Levels remain active until first price contact
- Optional historical display after mitigation
- Adjustable Flat Candle line color and thickness
- Adjustable True Gap band and border colors
- Optional labels for Flat Candles and True Gaps
- Adjustable number of historical Flat Candle lines
- Adjustable number of historical True Gap bands
- Works directly on the price chart
The purpose of the indicator is to provide a clean visual reference for untested Flat Candle levels and genuine price gaps without adding trade signals, market structure, or additional filters.
It is intended as a simple charting tool rather than a complete trading strategy.
This indicator is designed to identify and display two simple price-action elements: **Flat Candles** and **True Gaps**.
A **Flat Candle** is defined as a candle with no wick on one side:
- No upper wick → a horizontal line is drawn from the candle's high.
- No lower wick → a horizontal line is drawn from the candle's low.
- If both sides are flat, both levels are displayed.
Each Flat Candle level extends to the right until a future candle touches it. When the level is touched, the line can either stop at the touching candle and remain visible as historical reference, or be removed completely, depending on the selected setting.
A **True Gap** is a real price gap between two consecutive candles:
- Bullish True Gap: the current candle's low is above the previous candle's high.
- Bearish True Gap: the current candle's high is below the previous candle's low.
The indicator draws a band covering the exact untraded price area between the two candles. The band extends to the right until price touches any part of the gap. Once touched, the band can remain on the chart and stop at the mitigation candle, or disappear completely.
### Features
- Detects upper and lower Flat Candle levels
- Detects bullish and bearish True Gaps
- Flat Candle lines begin directly from the originating candle
- True Gap bands cover only the actual gap area
- Levels remain active until first price contact
- Optional historical display after mitigation
- Adjustable Flat Candle line color and thickness
- Adjustable True Gap band and border colors
- Optional labels for Flat Candles and True Gaps
- Adjustable number of historical Flat Candle lines
- Adjustable number of historical True Gap bands
- Works directly on the price chart
The purpose of the indicator is to provide a clean visual reference for untested Flat Candle levels and genuine price gaps without adding trade signals, market structure, or additional filters.
It is intended as a simple charting tool rather than a complete trading strategy.
Informacje o Wersji
Version 3 Update – Improved Higher-Timeframe Flat Candle DetectionThis update improves the way the indicator detects and manages Flat Candles, especially on higher timeframes such as **8H, 12H, Daily, and Weekly charts**.
Changes
- **Improved Flat Candle detection on higher timeframes**
- The previous version required the wick to be exactly zero.
- On higher timeframes, some candles can visually appear completely flat while still containing a very small wick in the underlying OHLC data.
- A new optional **Visual Tolerance** mode has been added to handle these cases.
- **Two Flat Candle detection modes are now available**
- **Strict (Exact):** A candle is considered flat only when there is absolutely no wick.
- **Visual Tolerance:** A very small wick can still qualify as a Flat Candle.
- **Adjustable wick tolerance**
- Users can define the maximum wick size as a percentage of the candle's total High-Low range.
- The default tolerance is **1%**.
- This makes the indicator more adaptable across different assets, price scales, and timeframes.
- **Historical object management has been corrected**
- In the previous version, the history limit included both active and already mitigated levels.
- This could cause an older but still valid Flat Candle or True Gap to disappear simply because newer objects were created.
- The history limit now applies **only to already mitigated historical objects**.
- **Active levels are preserved**
- An untouched Flat Candle level will remain on the chart regardless of the historical display limit.
- An untouched True Gap will also remain active until price reaches it.
- **Mitigated levels remain available for review**
- When the option to preserve mitigated levels is enabled, Flat Candle lines and True Gap bands stop exactly at the candle that first touches them.
- The number of these completed historical objects can be adjusted independently.
### Recommended settings
For strict price-action analysis:
**Detection Mode:** `Strict (Exact)`
For higher-timeframe charts where extremely small wicks may be visually insignificant:
**Detection Mode:** `Visual Tolerance`
**Maximum Wick:** `1.0%`
The tolerance can be increased slightly, for example to **1.5% or 2%**, if needed. Higher values should be used carefully because they may classify candles with meaningful wicks as Flat Candles.
This update keeps the indicator simple while making Flat Candle detection more reliable across different timeframes.
Informacje o Wersji
Version 5 Update- Fixed Flat Candle lines continuing through candles after the level had already been touched.
- Flat Candle levels now stop at the **first future candle that touches them**.
- Wick contact is enough to mark the level as mitigated.
- Removed the previous **leave-then-retest** logic that could keep lines active too long.
- In **Visual Tolerance** mode, the line now starts from the visible flat body edge instead of the tip of a tiny tolerated wick.
- Added an optional setting to ignore only the next candle’s shared-open contact. It is **OFF by default** for strict behavior.

Wyłączenie odpowiedzialności
Informacje i publikacje nie stanowią i nie powinny być traktowane jako porady finansowe, inwestycyjne, tradingowe ani jakiekolwiek inne rekomendacje dostarczane lub zatwierdzone przez TradingView. Więcej informacji znajduje się w Warunkach użytkowania.
Wyłączenie odpowiedzialności
Informacje i publikacje nie stanowią i nie powinny być traktowane jako porady finansowe, inwestycyjne, tradingowe ani jakiekolwiek inne rekomendacje dostarczane lub zatwierdzone przez TradingView. Więcej informacji znajduje się w Warunkach użytkowania.