OPEN-SOURCE SCRIPT
RichmondHillCM - VWAP & Volume-Spike Suite V1.3
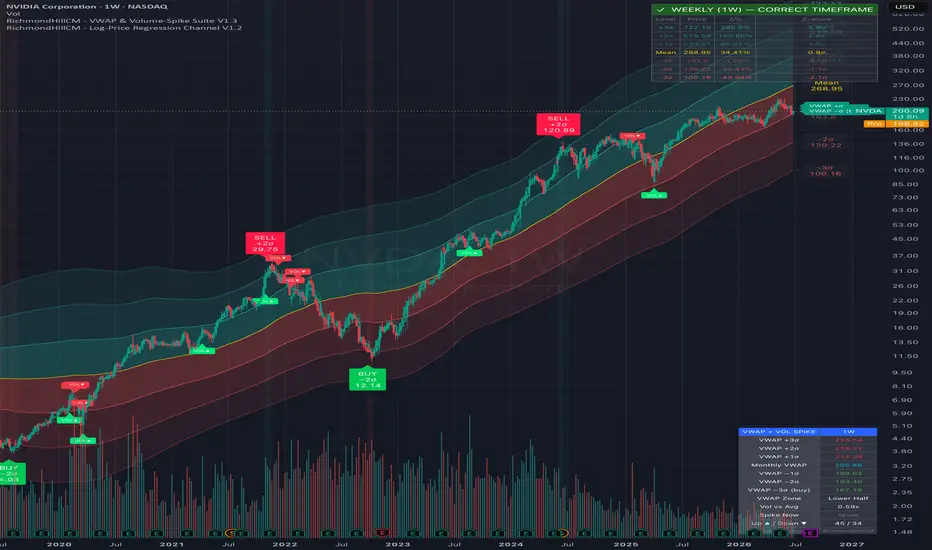
RichmondHillCM — VWAP & Volume-Spike Suite
A clean, focused overlay that combines an anchored monthly VWAP with above-average volume detection to flag high-conviction bars in real time. Built for the weekly chart but works on any timeframe.
What it does
The indicator watches for volume spikes — bars where volume rises above its own moving average by a set threshold — and marks each one with a directional triangle:
Green up-triangle (below the bar) — a volume spike closing on the bullish side (buyers in control)
Red down-triangle (above the bar) — a volume spike closing on the bearish side (sellers in control)
"Bullish" and "bearish" are, by default, defined relative to the monthly VWAP: a spike closing above VWAP prints an up-triangle; below VWAP prints a down-triangle. This ties conviction (volume) to fair value (VWAP) in a single, easy-to-read signal.
The VWAP structure
An anchored VWAP resets at the start of each month and acts as the volume-weighted "fair value" pivot. Standard-deviation bands bracket the typical range around it:
Lower bands (−1σ / −2σ / −3σ) — progressively cheap vs fair value; classic long / entry zones
Upper bands (+1σ / +2σ / +3σ) — progressively rich vs fair value; scale-out / short zones
VWAP itself — the mean pivot: reclaim = bullish, lose = bearish
A live summary table lists all seven VWAP levels (±1σ, ±2σ, ±3σ and the mean), the current VWAP zone, the latest volume-vs-average ratio, the live spike state, and a running count of bullish vs bearish spikes. On a weekly chart each month spans roughly 4–5 bars, giving the VWAP and its bands enough data to be meaningful.
Settings
Volume MA length and spike threshold (× average)
Direction definition: VWAP-relative (default), Candle (close vs open), or Close-to-Close
Band width (σ multiplier) for the plotted band, plus toggles for bands, shading, and on-chart labels
Optional "confirm on bar close" to avoid intrabar repaint on the live bar
Summary table with a Top / Bottom position toggle
Built-in alerts for bullish/bearish spikes and VWAP reclaim/loss
How to use it
Watch for a lower-band tag paired with a bullish spike triangle as a potential long, and an upper-band tag paired with a bearish spike triangle as a scale-out or short. Use the VWAP itself as your mean pivot — trading above it favors longs, below it favors shorts.
For educational and informational purposes only; not financial advice. Always do your own research and manage risk.
A clean, focused overlay that combines an anchored monthly VWAP with above-average volume detection to flag high-conviction bars in real time. Built for the weekly chart but works on any timeframe.
What it does
The indicator watches for volume spikes — bars where volume rises above its own moving average by a set threshold — and marks each one with a directional triangle:
Green up-triangle (below the bar) — a volume spike closing on the bullish side (buyers in control)
Red down-triangle (above the bar) — a volume spike closing on the bearish side (sellers in control)
"Bullish" and "bearish" are, by default, defined relative to the monthly VWAP: a spike closing above VWAP prints an up-triangle; below VWAP prints a down-triangle. This ties conviction (volume) to fair value (VWAP) in a single, easy-to-read signal.
The VWAP structure
An anchored VWAP resets at the start of each month and acts as the volume-weighted "fair value" pivot. Standard-deviation bands bracket the typical range around it:
Lower bands (−1σ / −2σ / −3σ) — progressively cheap vs fair value; classic long / entry zones
Upper bands (+1σ / +2σ / +3σ) — progressively rich vs fair value; scale-out / short zones
VWAP itself — the mean pivot: reclaim = bullish, lose = bearish
A live summary table lists all seven VWAP levels (±1σ, ±2σ, ±3σ and the mean), the current VWAP zone, the latest volume-vs-average ratio, the live spike state, and a running count of bullish vs bearish spikes. On a weekly chart each month spans roughly 4–5 bars, giving the VWAP and its bands enough data to be meaningful.
Settings
Volume MA length and spike threshold (× average)
Direction definition: VWAP-relative (default), Candle (close vs open), or Close-to-Close
Band width (σ multiplier) for the plotted band, plus toggles for bands, shading, and on-chart labels
Optional "confirm on bar close" to avoid intrabar repaint on the live bar
Summary table with a Top / Bottom position toggle
Built-in alerts for bullish/bearish spikes and VWAP reclaim/loss
How to use it
Watch for a lower-band tag paired with a bullish spike triangle as a potential long, and an upper-band tag paired with a bearish spike triangle as a scale-out or short. Use the VWAP itself as your mean pivot — trading above it favors longs, below it favors shorts.
For educational and informational purposes only; not financial advice. Always do your own research and manage risk.
Skrypt open-source
W zgodzie z duchem TradingView twórca tego skryptu udostępnił go jako open-source, aby użytkownicy mogli przejrzeć i zweryfikować jego działanie. Ukłony dla autora. Korzystanie jest bezpłatne, jednak ponowna publikacja kodu podlega naszym Zasadom serwisu.

Wyłączenie odpowiedzialności
Informacje i publikacje nie stanowią i nie powinny być traktowane jako porady finansowe, inwestycyjne, tradingowe ani jakiekolwiek inne rekomendacje dostarczane lub zatwierdzone przez TradingView. Więcej informacji znajduje się w Warunkach użytkowania.
Skrypt open-source
W zgodzie z duchem TradingView twórca tego skryptu udostępnił go jako open-source, aby użytkownicy mogli przejrzeć i zweryfikować jego działanie. Ukłony dla autora. Korzystanie jest bezpłatne, jednak ponowna publikacja kodu podlega naszym Zasadom serwisu.
Wyłączenie odpowiedzialności
Informacje i publikacje nie stanowią i nie powinny być traktowane jako porady finansowe, inwestycyjne, tradingowe ani jakiekolwiek inne rekomendacje dostarczane lub zatwierdzone przez TradingView. Więcej informacji znajduje się w Warunkach użytkowania.