Market Rhythm Signals ( 8-13-21-34 )
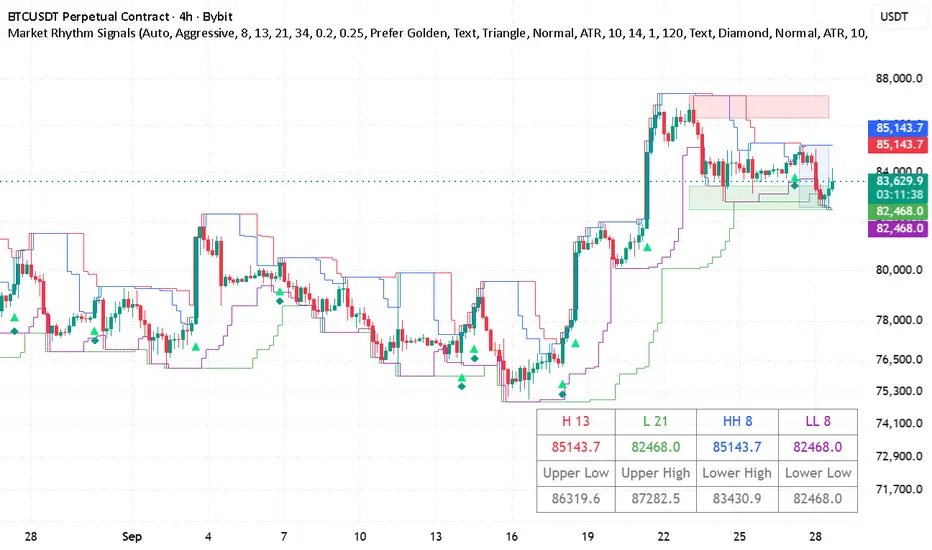
Market Rhythm Signals — Non-Repainting Market Structure
8-bar shifts. 13-bar highs. 21-bar lows. 34-bar exhaustion zones. One structural view of market rhythm.
Most traders look at individual candles.
Market Rhythm Signals was built around a different idea: price develops a rhythm across multiple structural windows, and those structures can be used together to identify where the market is, where pressure is building, and when directional structure has actually changed.
The indicator uses consecutive Fibonacci lookback periods — 8, 13, 21 and 34 bars — to observe market structure across multiple horizons.
The framework combines four core components:
• HH8 / LL8 — 8-bar structural shift levels
• H13 — 13-bar high
• L21 — 21-bar low
• 34-bar upper and lower exhaustion zones
Together, these levels create a dynamic framework for reading market structure rather than relying on a single oscillator or isolated signal.
CORE STRUCTURE
H13 — 13-Bar High
H13 tracks the highest price reached during the most recent 13 bars.It acts as an upper structural reference and helps show how the market's short-to-medium-term range is evolving.
L21 — 21-Bar Low
L21 tracks the lowest price reached during the most recent 21 bars. It provides the corresponding lower structural reference.
HH8 / LL8 — Bias Shift Levels
HH8 and LL8 represent the short-term structural boundaries used to identify directional changes. The levels are derived from the previous 8-bar structure, so the candle currently testing the level does not redefine its own breakout threshold. When price closes beyond one of these levels and the active filters agree, the indicator can generate a Bias Shift signal.
BIAS SHIFT SIGNALS
A Bias Shift represents a confirmed change in short-term structural pressure.
Bullish Bias Shift
Price closes above the upper 8-bar structural boundary while satisfying the active confirmation filters.
Bearish Bias Shift
Price closes below the lower 8-bar structural boundary while satisfying the active confirmation filters.
Signals are evaluated on confirmed candle closes. Temporary intrabar movements are not used to create final directional signals.
GOLDEN SIGNALS
Golden signals are higher-confluence structural signals. They combine the underlying structural breakout with additional confirmation such as:
• EMA trend alignment
• volatility conditions
• cooldown logic
• higher-timeframe confirmation
• exhaustion-zone context
Golden signals are not intended to be interpreted as automatic buy or sell instructions.
They represent situations where several structural conditions align simultaneously.
34-BAR EXHAUSTION ZONES
The indicator calculates the recent 34-bar price range and defines an upper and lower exhaustion area.
Upper Exhaustion Zone
Shows when price is trading near the upper extreme of its recent structural range.
Lower Exhaustion Zone
Shows when price is trading near the lower extreme of its recent structural range.
These areas are context zones, not automatic reversal signals.
A breakout occurring from the middle of a structure is different from a breakout occurring after price has already reached an extreme.
That context is one of the central ideas behind Market Rhythm Signals.
DECISION ZONE
HH8 and LL8 define the indicator's dynamic Decision Zone.
This area represents the short-term structural range the market must resolve before a clearer directional bias develops. The Decision Zone can adapt visually according to the relationship between price, the trend filter and an ATR-based neutral band.
It provides a quick distinction between:
Bullish structure
Bearish structure
Neutral / ranging structure
HIGHER-TIMEFRAME CONFIRMATION
Market Rhythm Signals can use higher-timeframe trend information as an additional confirmation layer. The non-repainting implementation uses completed higher-timeframe information rather than an unfinished HTF candle. This prevents a higher-timeframe condition from changing simply because the current HTF candle is still developing.
NON-REPAINTING DESIGN
This version was designed around confirmed market information. Directional signals are generated only after the chart candle closes.
The 8-bar structural thresholds are based on previously completed bars, while higher-timeframe confirmation uses completed HTF data. As a result, a confirmed signal is not intentionally removed because price later moved back across the level during the same candle.
Non-repainting does not mean predictive. It only means that the signal-generation logic is based on confirmed rather than temporary intrabar conditions.
PRESETS
Market Rhythm Signals includes:
Auto
Scalp
Intraday
Swing
Position
Custom
Auto automatically adapts the operating profile to the chart timeframe, while Custom provides manual control over the principal filters.
Three sensitivity profiles are also available:
Conservative
Balanced
Aggressive
These profiles modify signal selectivity while preserving the underlying structural framework.
HOW TO READ MARKET RHYTHM SIGNALS
The indicator is designed primarily as a market-structure and context tool.
Rather than asking only:
“Is price going up or down?”
the framework is intended to help answer:
“Where is price within its current structure, and has that structure actually changed?”
A practical way to read the chart is:
Structure → Decision Zone → Bias Shift → Confirmation → Exhaustion Context
The individual signals are only one part of the indicator.
The main value comes from understanding how price interacts with the complete 8 / 13 / 21 / 34 structure.
FULL MARKET RHYTHM STRUCTURE
8-bar shifts, 13-bar highs, 21-bar lows and 34-bar exhaustion zones working as one structural framework.

BULLISH STRUCTURE EXAMPLE
Confirmed bullish structural shifts as the market transitions from consolidation into directional expansion.

BEARISH STRUCTURE EXAMPLE
Confirmed bearish structural shifts during a sustained deterioration in market structure.

ALERTS
Alerts are available for:
Bullish Bias Shift
Bearish Bias Shift
Golden Bull
Golden Bear
Upper Exhaustion Entry
Lower Exhaustion Entry
Webhook support is also available for external workflows. Directional alerts are based on confirmed bars.
ABOUT THE CONCEPT
The consecutive Fibonacci windows — 8, 13, 21 and 34 — were translated into a rules-based framework combining short-term structural changes, intermediate price boundaries and broader exhaustion context.
Although the resulting structure can sometimes visually resemble wave-based analysis, Market Rhythm Signals does not automatically detect or count Elliott Waves.
It is a systematic market-structure framework based on rolling price levels and confirmed structural events.
ABOUT AND RISK DISCLOSURE
Market Rhythm Signals is provided for informational and educational purposes only and does not constitute financial or investment advice. Its signals and levels are based on historical price data, may be incorrect, and do not guarantee future market movements or trading results. Confirmation at bar close helps prevent intrabar signal changes, but it does not eliminate market risk or ensure profitability. Trading involves substantial risk, including the possible loss of all capital committed to trading, and past performance is not a reliable indicator of future results. Before acting on any signal, assess its suitability for your circumstances and use appropriate risk management, including position sizing and stop-loss orders, while recognizing that these measures cannot eliminate losses.
You remain responsible for your trading decisions and their outcomes.
8-bar shifts. 13-bar highs. 21-bar lows. 34-bar exhaustion zones. One structural view of market rhythm.
Most traders look at individual candles.
Market Rhythm Signals was built around a different idea: price develops a rhythm across multiple structural windows, and those structures can be used together to identify where the market is, where pressure is building, and when directional structure has actually changed.
The indicator uses consecutive Fibonacci lookback periods — 8, 13, 21 and 34 bars — to observe market structure across multiple horizons.
The framework combines four core components:
• HH8 / LL8 — 8-bar structural shift levels
• H13 — 13-bar high
• L21 — 21-bar low
• 34-bar upper and lower exhaustion zones
Together, these levels create a dynamic framework for reading market structure rather than relying on a single oscillator or isolated signal.
CORE STRUCTURE
H13 — 13-Bar High
H13 tracks the highest price reached during the most recent 13 bars.It acts as an upper structural reference and helps show how the market's short-to-medium-term range is evolving.
L21 — 21-Bar Low
L21 tracks the lowest price reached during the most recent 21 bars. It provides the corresponding lower structural reference.
HH8 / LL8 — Bias Shift Levels
HH8 and LL8 represent the short-term structural boundaries used to identify directional changes. The levels are derived from the previous 8-bar structure, so the candle currently testing the level does not redefine its own breakout threshold. When price closes beyond one of these levels and the active filters agree, the indicator can generate a Bias Shift signal.
BIAS SHIFT SIGNALS
A Bias Shift represents a confirmed change in short-term structural pressure.
Bullish Bias Shift
Price closes above the upper 8-bar structural boundary while satisfying the active confirmation filters.
Bearish Bias Shift
Price closes below the lower 8-bar structural boundary while satisfying the active confirmation filters.
Signals are evaluated on confirmed candle closes. Temporary intrabar movements are not used to create final directional signals.
GOLDEN SIGNALS
Golden signals are higher-confluence structural signals. They combine the underlying structural breakout with additional confirmation such as:
• EMA trend alignment
• volatility conditions
• cooldown logic
• higher-timeframe confirmation
• exhaustion-zone context
Golden signals are not intended to be interpreted as automatic buy or sell instructions.
They represent situations where several structural conditions align simultaneously.
34-BAR EXHAUSTION ZONES
The indicator calculates the recent 34-bar price range and defines an upper and lower exhaustion area.
Upper Exhaustion Zone
Shows when price is trading near the upper extreme of its recent structural range.
Lower Exhaustion Zone
Shows when price is trading near the lower extreme of its recent structural range.
These areas are context zones, not automatic reversal signals.
A breakout occurring from the middle of a structure is different from a breakout occurring after price has already reached an extreme.
That context is one of the central ideas behind Market Rhythm Signals.
DECISION ZONE
HH8 and LL8 define the indicator's dynamic Decision Zone.
This area represents the short-term structural range the market must resolve before a clearer directional bias develops. The Decision Zone can adapt visually according to the relationship between price, the trend filter and an ATR-based neutral band.
It provides a quick distinction between:
Bullish structure
Bearish structure
Neutral / ranging structure
HIGHER-TIMEFRAME CONFIRMATION
Market Rhythm Signals can use higher-timeframe trend information as an additional confirmation layer. The non-repainting implementation uses completed higher-timeframe information rather than an unfinished HTF candle. This prevents a higher-timeframe condition from changing simply because the current HTF candle is still developing.
NON-REPAINTING DESIGN
This version was designed around confirmed market information. Directional signals are generated only after the chart candle closes.
The 8-bar structural thresholds are based on previously completed bars, while higher-timeframe confirmation uses completed HTF data. As a result, a confirmed signal is not intentionally removed because price later moved back across the level during the same candle.
Non-repainting does not mean predictive. It only means that the signal-generation logic is based on confirmed rather than temporary intrabar conditions.
PRESETS
Market Rhythm Signals includes:
Auto
Scalp
Intraday
Swing
Position
Custom
Auto automatically adapts the operating profile to the chart timeframe, while Custom provides manual control over the principal filters.
Three sensitivity profiles are also available:
Conservative
Balanced
Aggressive
These profiles modify signal selectivity while preserving the underlying structural framework.
HOW TO READ MARKET RHYTHM SIGNALS
The indicator is designed primarily as a market-structure and context tool.
Rather than asking only:
“Is price going up or down?”
the framework is intended to help answer:
“Where is price within its current structure, and has that structure actually changed?”
A practical way to read the chart is:
Structure → Decision Zone → Bias Shift → Confirmation → Exhaustion Context
The individual signals are only one part of the indicator.
The main value comes from understanding how price interacts with the complete 8 / 13 / 21 / 34 structure.
FULL MARKET RHYTHM STRUCTURE
8-bar shifts, 13-bar highs, 21-bar lows and 34-bar exhaustion zones working as one structural framework.
BULLISH STRUCTURE EXAMPLE
Confirmed bullish structural shifts as the market transitions from consolidation into directional expansion.
BEARISH STRUCTURE EXAMPLE
Confirmed bearish structural shifts during a sustained deterioration in market structure.
ALERTS
Alerts are available for:
Bullish Bias Shift
Bearish Bias Shift
Golden Bull
Golden Bear
Upper Exhaustion Entry
Lower Exhaustion Entry
Webhook support is also available for external workflows. Directional alerts are based on confirmed bars.
ABOUT THE CONCEPT
The consecutive Fibonacci windows — 8, 13, 21 and 34 — were translated into a rules-based framework combining short-term structural changes, intermediate price boundaries and broader exhaustion context.
Although the resulting structure can sometimes visually resemble wave-based analysis, Market Rhythm Signals does not automatically detect or count Elliott Waves.
It is a systematic market-structure framework based on rolling price levels and confirmed structural events.
ABOUT AND RISK DISCLOSURE
Market Rhythm Signals is provided for informational and educational purposes only and does not constitute financial or investment advice. Its signals and levels are based on historical price data, may be incorrect, and do not guarantee future market movements or trading results. Confirmation at bar close helps prevent intrabar signal changes, but it does not eliminate market risk or ensure profitability. Trading involves substantial risk, including the possible loss of all capital committed to trading, and past performance is not a reliable indicator of future results. Before acting on any signal, assess its suitability for your circumstances and use appropriate risk management, including position sizing and stop-loss orders, while recognizing that these measures cannot eliminate losses.
You remain responsible for your trading decisions and their outcomes.

Wyłączenie odpowiedzialności
Informacje i publikacje nie stanowią i nie powinny być traktowane jako porady finansowe, inwestycyjne, tradingowe ani jakiekolwiek inne rekomendacje dostarczane lub zatwierdzone przez TradingView. Więcej informacji znajduje się w Warunkach użytkowania.
Wyłączenie odpowiedzialności
Informacje i publikacje nie stanowią i nie powinny być traktowane jako porady finansowe, inwestycyjne, tradingowe ani jakiekolwiek inne rekomendacje dostarczane lub zatwierdzone przez TradingView. Więcej informacji znajduje się w Warunkach użytkowania.