Zaktualizowano
Triple Anchored VWAP [D/W/M]
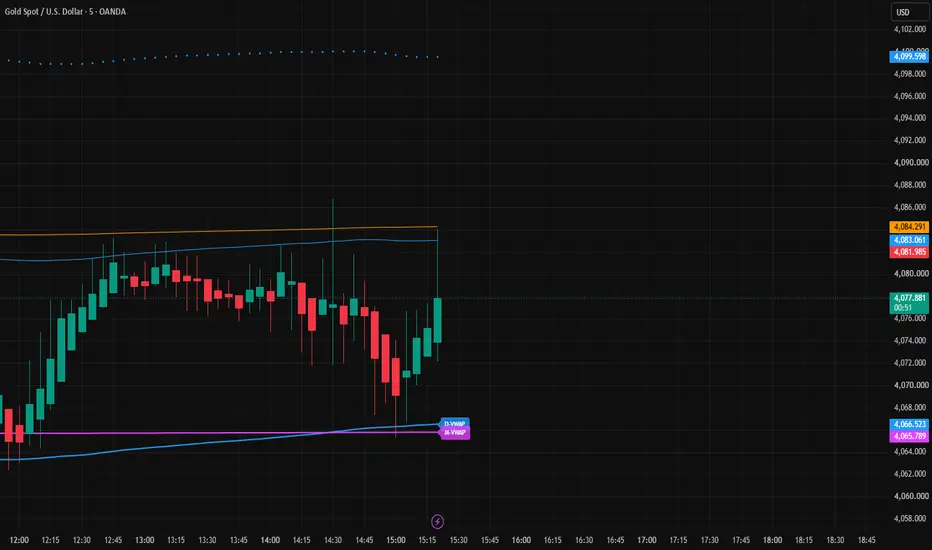
Triple Anchored VWAP [D/W/M]
Institutional-grade volume-weighted average price analysis across three timeframes — all in one clean, customizable indicator.
This script plots three independently anchored VWAPs that reset at the start of each session, week, and month. Each VWAP acts as a dynamic fair-value level, showing where the average trader has been positioned over that period weighted by actual volume — making them far more meaningful than simple moving averages.
─── What's included ───
• Daily VWAP — resets every session, ideal for intraday and short-term traders
• Weekly VWAP — tracks fair value over the rolling week, great for swing setups
• Monthly VWAP — macro-level mean reversion and trend bias reference
Each VWAP includes:
→ 2 standard deviation bands (Band 1 and Band 2) with adjustable multipliers
→ Full color customization for the VWAP line and both deviation bands
→ Adjustable line width per timeframe
→ Toggle visibility of each VWAP and its bands independently
→ End-of-line labels (D-VWAP / W-VWAP / M-VWAP) so you always know what you're looking at
→ Source selection (HLC3, close, open, HL2, etc.)
─── Alerts ───
6 built-in alert conditions — price cross above and below each of the three VWAPs. Set them up in TradingView's Alerts menu and never miss a key level again.
─── How to use it ───
The deviation bands act as dynamic support and resistance. Price hugging the VWAP = balanced market. Price stretched toward Band 2 = extended, watch for reversion. A clean break and hold above the Weekly or Monthly VWAP often signals a shift in trend bias.
Works best on intraday charts (1m–4H) for the Daily VWAP, and daily/weekly charts for the Weekly and Monthly levels.
─── Settings ───
All three VWAPs are fully independent — toggle them on/off, adjust colors, band multipliers, line width, source, and labels separately. No clutter, just the levels you want.
Open-source and free for the community. Feedback and suggestions welcome.
Informacje o Wersji
Triple Anchored VWAP [D/W/M] - v2WHAT'S NEW IN THIS VERSION
Fixed a label reprint issue where the D/W/M tags left a trailing "comet" of duplicate labels across bars during live sessions. Each VWAP label is now a single persistent object that rides the last bar, so you get one clean tag per line at the right edge, on historical data and in real time.
Also updated the script to Pine Script v6. No changes to calculations, inputs, or visuals. If you were already running the previous version, this is a drop-in update.
WHAT THIS INDICATOR DOES
Three anchored VWAPs on one overlay, each resetting on its own period:
- Daily, Weekly, and Monthly VWAP, fully independent
- Per-VWAP controls for source, line color, and width
- 1st and 2nd standard-deviation bands with independent show/hide toggles
- Right-edge labels (D-VWAP / W-VWAP / M-VWAP)
- Cross-above and cross-below alerts on every line
Anchored VWAP shows the volume-weighted average price since the start of each period, which many traders use as a dynamic reference for institutional value and mean reversion. The standard-deviation bands act as volume-weighted support and resistance around each anchor.
HOW TO USE IT
- Treat each VWAP as a dynamic level: price above tends to favor longs, below tends to favor shorts, on that timeframe's horizon.
- The strongest reactions often come where two or more VWAPs cluster together. Those confluence zones tend to hold better than any single line.
- Use the standard-deviation bands to gauge stretch. Price at the 2nd band is extended from its anchor and more prone to snapping back.
- Match the anchor to your style: Daily for intraday, Weekly and Monthly for swing context. Layer them for a top-down read.
This tool is for chart analysis and education, not financial advice. Always test on your own instruments and timeframes before trading.

Wyłączenie odpowiedzialności
Informacje i publikacje nie stanowią i nie powinny być traktowane jako porady finansowe, inwestycyjne, tradingowe ani jakiekolwiek inne rekomendacje dostarczane lub zatwierdzone przez TradingView. Więcej informacji znajduje się w Warunkach użytkowania.
Wyłączenie odpowiedzialności
Informacje i publikacje nie stanowią i nie powinny być traktowane jako porady finansowe, inwestycyjne, tradingowe ani jakiekolwiek inne rekomendacje dostarczane lub zatwierdzone przez TradingView. Więcej informacji znajduje się w Warunkach użytkowania.