Opening Range Levels
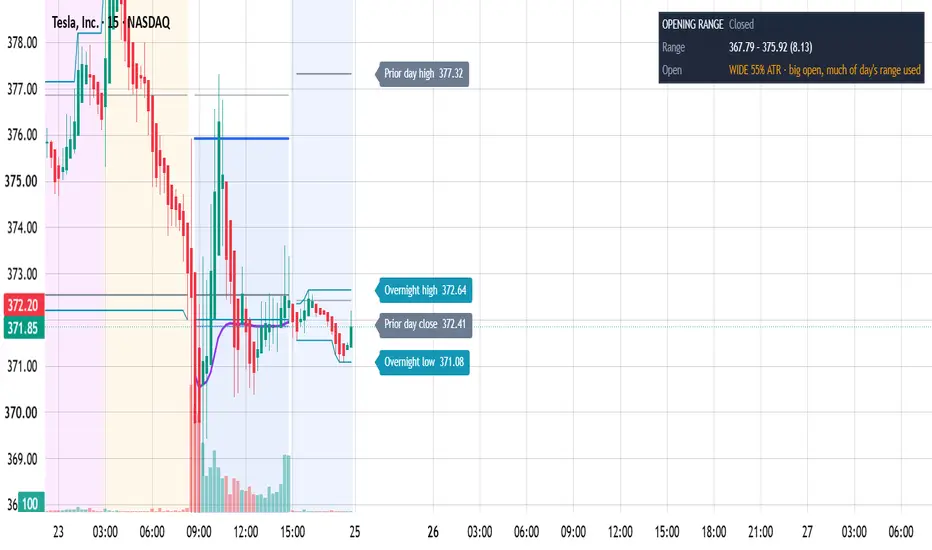
Opening Range Levels — Lite
What it does
Draws the session opening range and the structural levels intraday traders reference around it, each named at the right edge with its exact price:
• Opening range high, low and middle (length in minutes, default 15)
• 1× range moves above and below the range (range height added to the high / subtracted from the low)
• Session VWAP (regular session only, typical price × volume)
• Prior day high, low and close (last completed regular session)
• Overnight high and low (bars outside the regular session; needs extended hours enabled)
Reading the open
The info box shows the opening range as a percentage of the prior day's 14-period ATR:
• NARROW (≤ 20%) – a quiet open; the day still has most of its typical range available
• NORMAL
• WIDE (≥ 40%) – a large open; much of a typical day's range is already used
Both thresholds are inputs. The classification describes the open; it is not a signal.
How to use
• Use a chart timeframe that divides the range length evenly: 1, 3, 5 or 15 minutes for a 15-minute range; 1 or 5 minutes for a 5-minute range. The box says so if the timeframe doesn't fit, instead of drawing a wrong range.
• Default session is 09:30–16:00 New York. Change the session and timezone for other markets.
• Outside regular hours (extended-hours charts), "prior day" means the session that just closed and the overnight levels update live, so the chart is ready for the next open.
• "Show levels for: Today only" keeps the chart clean; switch to "All sessions" to review past days.
Display
• Labels stack so they never overlap; raise "Label spacing" on tall charts.
• Line colors are set per line in the Style tab. Label colors are in Inputs.
• Line values are kept off the price scale and status line to reduce clutter; re-enable them per line in the Style tab.
Limits
• No signals, alerts or targets.
• Values do not repaint: the ATR uses the prior completed day only.
• Overnight levels need extended hours enabled; VWAP needs volume data.
• On Heikin Ashi charts the levels use Heikin Ashi values; use standard candles.
What it does
Draws the session opening range and the structural levels intraday traders reference around it, each named at the right edge with its exact price:
• Opening range high, low and middle (length in minutes, default 15)
• 1× range moves above and below the range (range height added to the high / subtracted from the low)
• Session VWAP (regular session only, typical price × volume)
• Prior day high, low and close (last completed regular session)
• Overnight high and low (bars outside the regular session; needs extended hours enabled)
Reading the open
The info box shows the opening range as a percentage of the prior day's 14-period ATR:
• NARROW (≤ 20%) – a quiet open; the day still has most of its typical range available
• NORMAL
• WIDE (≥ 40%) – a large open; much of a typical day's range is already used
Both thresholds are inputs. The classification describes the open; it is not a signal.
How to use
• Use a chart timeframe that divides the range length evenly: 1, 3, 5 or 15 minutes for a 15-minute range; 1 or 5 minutes for a 5-minute range. The box says so if the timeframe doesn't fit, instead of drawing a wrong range.
• Default session is 09:30–16:00 New York. Change the session and timezone for other markets.
• Outside regular hours (extended-hours charts), "prior day" means the session that just closed and the overnight levels update live, so the chart is ready for the next open.
• "Show levels for: Today only" keeps the chart clean; switch to "All sessions" to review past days.
Display
• Labels stack so they never overlap; raise "Label spacing" on tall charts.
• Line colors are set per line in the Style tab. Label colors are in Inputs.
• Line values are kept off the price scale and status line to reduce clutter; re-enable them per line in the Style tab.
Limits
• No signals, alerts or targets.
• Values do not repaint: the ATR uses the prior completed day only.
• Overnight levels need extended hours enabled; VWAP needs volume data.
• On Heikin Ashi charts the levels use Heikin Ashi values; use standard candles.

Wyłączenie odpowiedzialności
Informacje i publikacje nie stanowią i nie powinny być traktowane jako porady finansowe, inwestycyjne, tradingowe ani jakiekolwiek inne rekomendacje dostarczane lub zatwierdzone przez TradingView. Więcej informacji znajduje się w Warunkach użytkowania.
Wyłączenie odpowiedzialności
Informacje i publikacje nie stanowią i nie powinny być traktowane jako porady finansowe, inwestycyjne, tradingowe ani jakiekolwiek inne rekomendacje dostarczane lub zatwierdzone przez TradingView. Więcej informacji znajduje się w Warunkach użytkowania.