SachinRkGandhi India VIX Live
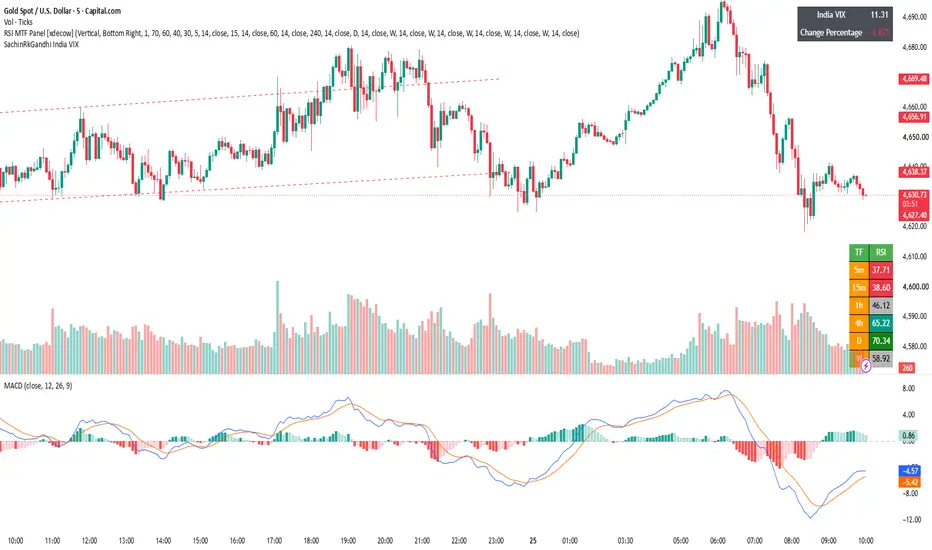
# India VIX Live Value & Change Percentage Indicator
**India VIX by Sachin Raj Kumar Gandhi** is a TradingView indicator designed to provide a quick and clear view of the **live India VIX (Volatility Index) value** directly on the price chart.
The indicator displays:
* **India VIX – Live Value**
* **Change Percentage – Live % Change**
By keeping the India VIX information directly on the chart, traders can quickly monitor changes in market volatility without switching to a separate indicator panel.
### How It Helps
India VIX reflects the expected volatility in the Indian equity market. Monitoring its movement can provide useful context for **intraday trading, scalping, and short-term trade management**.
A rising VIX may indicate increasing market uncertainty and volatility, while a falling VIX may indicate relatively lower expected volatility.
This indicator can therefore be used alongside **Price Action, Technical Indicators, Options Data, and Market Structure** to help traders understand the prevailing volatility environment.
**Designed by Sachin Raj Kumar Gandhi**
*For educational and analytical purposes only. It is not a trading recommendation or financial advice.*
**India VIX by Sachin Raj Kumar Gandhi** is a TradingView indicator designed to provide a quick and clear view of the **live India VIX (Volatility Index) value** directly on the price chart.
The indicator displays:
* **India VIX – Live Value**
* **Change Percentage – Live % Change**
By keeping the India VIX information directly on the chart, traders can quickly monitor changes in market volatility without switching to a separate indicator panel.
### How It Helps
India VIX reflects the expected volatility in the Indian equity market. Monitoring its movement can provide useful context for **intraday trading, scalping, and short-term trade management**.
A rising VIX may indicate increasing market uncertainty and volatility, while a falling VIX may indicate relatively lower expected volatility.
This indicator can therefore be used alongside **Price Action, Technical Indicators, Options Data, and Market Structure** to help traders understand the prevailing volatility environment.
**Designed by Sachin Raj Kumar Gandhi**
*For educational and analytical purposes only. It is not a trading recommendation or financial advice.*

Wyłączenie odpowiedzialności
Informacje i publikacje nie stanowią i nie powinny być traktowane jako porady finansowe, inwestycyjne, tradingowe ani jakiekolwiek inne rekomendacje dostarczane lub zatwierdzone przez TradingView. Więcej informacji znajduje się w Warunkach użytkowania.
Wyłączenie odpowiedzialności
Informacje i publikacje nie stanowią i nie powinny być traktowane jako porady finansowe, inwestycyjne, tradingowe ani jakiekolwiek inne rekomendacje dostarczane lub zatwierdzone przez TradingView. Więcej informacji znajduje się w Warunkach użytkowania.