Market Network Confirmation [NeuralMarkets]
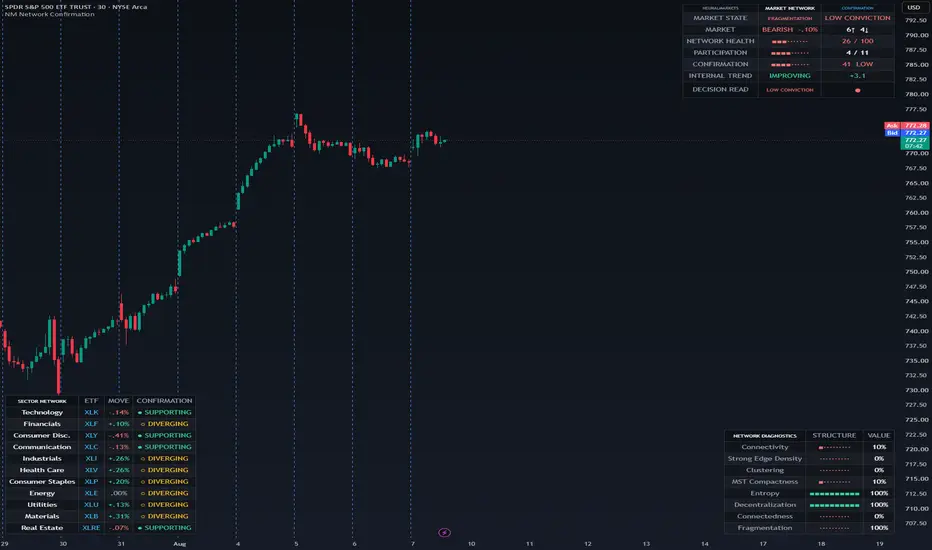
Market Network Confirmation [NeuralMarkets]
Price tells you where the market moved. The network tells you whether the market moved together.
A strong index move can look convincing on the surface and still be structurally weak underneath.
This indicator was built to measure that difference.
What this indicator is designed to answer
Not:
"Is SPY up or down?"
But:
"Is the current move actually supported by the market underneath it?"
Market Network Confirmation analyzes the internal structure of the S&P 500 through its major sector ETFs and combines breadth with graph-based network analytics.
The result is a structural read on whether the current move is broad, narrow, deteriorating, recovering, or fragmented.
The Market as a Network
The indicator models the major SPDR sector ETFs as nodes in a financial network:
XLK - Technology
XLF - Financials
XLY - Consumer Discretionary
XLC - Communication Services
XLI - Industrials
XLV - Health Care
XLP - Consumer Staples
XLE - Energy
XLU - Utilities
XLB - Materials
XLRE - Real Estate
Rolling relationships between sector returns form the edges of the network.
The indicator then evaluates the structure using multiple graph-theory measures instead of relying on a single breadth statistic.
Market States
Broad Confirmation
The index move is supported by broad sector participation and a healthy underlying network.
This is the cleanest confirmation state.
Narrow Advance
SPY is moving higher, but participation is limited or leadership is overly concentrated.
The move may still continue, but the internal structure is less convincing.
Internal Divergence
SPY continues to advance while network health deteriorates underneath.
Price strength and internal structure are moving in opposite directions.
Recovery Broadening
SPY remains weak, but internal network conditions are improving.
Participation may be strengthening before the index itself fully recovers.
Distribution
Selling is broadly confirmed while network health remains weak.
The decline is not isolated to a small part of the market.
Fragmentation
The sector network breaks into weakly connected groups.
In this environment, the market behaves less like one coherent system and more like a collection of disconnected sectors.
Healthy Rotation
No major structural warning is present, but the market is rotating rather than moving with strong broad confirmation.
Network Health
The indicator creates a composite Network Health score from several graph measures:
• Mean network connectivity
• Strong-edge density
• Clustering coefficient
• Minimum Spanning Tree compactness
• Network entropy
• Decentralization
• Connected components
The score is normalized from 0 to 100.
A high Network Health score means the sector network is structurally coherent and broadly connected.
A low score means relationships are weaker, more fragmented, or overly concentrated.
Important:
High Network Health is not automatically bullish.
A market can be strongly connected while rising or while falling.
Network Health measures structural coherence, not direction.
Participation
Participation measures how many sectors are moving in the same direction as SPY.
For example:
SPY rising + 9 of 11 sectors rising
indicates broad bullish participation.
SPY rising + only 4 of 11 sectors rising
indicates a narrow advance.
Participation tells you how many sectors agree.
Network Health tells you how structurally connected the market is.
Those are not the same thing.
Move Confirmation
Move Confirmation combines:
• Network Health
• Sector Participation
• Distribution of influence across the network
This creates a 0-100 measure of how strongly the internal market structure supports the current index move.
The dashboard classifies confirmation as:
• High
• Moderate
• Low
This is not a probability of future returns.
It is a measure of structural agreement behind the current move.
Internal Trend
The indicator also tracks whether network health is:
• Improving
• Stable
• Deteriorating
This becomes useful when price and internal structure start moving in opposite directions.
For example:
SPY making new highs while Network Health declines
is very different from:
SPY making new highs while Network Health strengthens.
Sector Network
The Sector Network panel shows which sectors are:
• Supporting the current SPY direction
• Diverging from it
This gives a fast view of whether the move is broad or being carried by only a few sectors.
Network Diagnostics
For users who want to inspect the underlying graph structure, the indicator exposes the individual network metrics.
Connectivity
Average strength of relationships across the sector network.
Strong Edge Density
Percentage of strong relationships currently present in the network.
Clustering
Measures whether sectors are forming tightly connected groups.
MST Compactness
Uses a Minimum Spanning Tree to measure how efficiently the full sector network can be connected.
Entropy
Measures how broadly network influence is distributed.
Decentralization
Shows whether the network is broadly distributed rather than dominated by a small number of nodes.
Connectedness
Measures how close the system is to behaving as one connected network.
Fragmentation
Measures how disconnected the market has become.
Why use network analysis?
Traditional breadth tools usually count:
• Advancers vs decliners
• Positive vs negative sectors
• Stocks above moving averages
• New highs vs new lows
Those are useful.
But they do not measure how relationships between market components are changing.
Two markets can both have 8 bullish sectors.
One may be tightly connected and behaving as a coherent market.
The other may contain several disconnected clusters with very weak relationships.
Graph analysis can distinguish between those structures.
Practical Use
Market Network Confirmation can be used as a second layer of analysis when evaluating:
• Breakouts
• Trend continuation
• Rally quality
• Selloff confirmation
• Market breadth
• Sector rotation
• Internal divergence
• Recovery attempts
Research tool only. Not a standalone buy/sell signal.
Price tells you where the market moved. The network tells you whether the market moved together.
A strong index move can look convincing on the surface and still be structurally weak underneath.
- Sometimes SPY rallies while only a handful of sectors participate.
- Sometimes the index is flat while participation quietly broadens.
- Sometimes the market looks healthy, but the sector network is already fragmenting.
This indicator was built to measure that difference.
What this indicator is designed to answer
Not:
"Is SPY up or down?"
But:
"Is the current move actually supported by the market underneath it?"
Market Network Confirmation analyzes the internal structure of the S&P 500 through its major sector ETFs and combines breadth with graph-based network analytics.
The result is a structural read on whether the current move is broad, narrow, deteriorating, recovering, or fragmented.
The Market as a Network
The indicator models the major SPDR sector ETFs as nodes in a financial network:
XLK - Technology
XLF - Financials
XLY - Consumer Discretionary
XLC - Communication Services
XLI - Industrials
XLV - Health Care
XLP - Consumer Staples
XLE - Energy
XLU - Utilities
XLB - Materials
XLRE - Real Estate
Rolling relationships between sector returns form the edges of the network.
The indicator then evaluates the structure using multiple graph-theory measures instead of relying on a single breadth statistic.
Market States
Broad Confirmation
The index move is supported by broad sector participation and a healthy underlying network.
This is the cleanest confirmation state.
Narrow Advance
SPY is moving higher, but participation is limited or leadership is overly concentrated.
The move may still continue, but the internal structure is less convincing.
Internal Divergence
SPY continues to advance while network health deteriorates underneath.
Price strength and internal structure are moving in opposite directions.
Recovery Broadening
SPY remains weak, but internal network conditions are improving.
Participation may be strengthening before the index itself fully recovers.
Distribution
Selling is broadly confirmed while network health remains weak.
The decline is not isolated to a small part of the market.
Fragmentation
The sector network breaks into weakly connected groups.
In this environment, the market behaves less like one coherent system and more like a collection of disconnected sectors.
Healthy Rotation
No major structural warning is present, but the market is rotating rather than moving with strong broad confirmation.
Network Health
The indicator creates a composite Network Health score from several graph measures:
• Mean network connectivity
• Strong-edge density
• Clustering coefficient
• Minimum Spanning Tree compactness
• Network entropy
• Decentralization
• Connected components
The score is normalized from 0 to 100.
A high Network Health score means the sector network is structurally coherent and broadly connected.
A low score means relationships are weaker, more fragmented, or overly concentrated.
Important:
High Network Health is not automatically bullish.
A market can be strongly connected while rising or while falling.
Network Health measures structural coherence, not direction.
Participation
Participation measures how many sectors are moving in the same direction as SPY.
For example:
SPY rising + 9 of 11 sectors rising
indicates broad bullish participation.
SPY rising + only 4 of 11 sectors rising
indicates a narrow advance.
Participation tells you how many sectors agree.
Network Health tells you how structurally connected the market is.
Those are not the same thing.
Move Confirmation
Move Confirmation combines:
• Network Health
• Sector Participation
• Distribution of influence across the network
This creates a 0-100 measure of how strongly the internal market structure supports the current index move.
The dashboard classifies confirmation as:
• High
• Moderate
• Low
This is not a probability of future returns.
It is a measure of structural agreement behind the current move.
Internal Trend
The indicator also tracks whether network health is:
• Improving
• Stable
• Deteriorating
This becomes useful when price and internal structure start moving in opposite directions.
For example:
SPY making new highs while Network Health declines
is very different from:
SPY making new highs while Network Health strengthens.
Sector Network
The Sector Network panel shows which sectors are:
• Supporting the current SPY direction
• Diverging from it
This gives a fast view of whether the move is broad or being carried by only a few sectors.
Network Diagnostics
For users who want to inspect the underlying graph structure, the indicator exposes the individual network metrics.
Connectivity
Average strength of relationships across the sector network.
Strong Edge Density
Percentage of strong relationships currently present in the network.
Clustering
Measures whether sectors are forming tightly connected groups.
MST Compactness
Uses a Minimum Spanning Tree to measure how efficiently the full sector network can be connected.
Entropy
Measures how broadly network influence is distributed.
Decentralization
Shows whether the network is broadly distributed rather than dominated by a small number of nodes.
Connectedness
Measures how close the system is to behaving as one connected network.
Fragmentation
Measures how disconnected the market has become.
Why use network analysis?
Traditional breadth tools usually count:
• Advancers vs decliners
• Positive vs negative sectors
• Stocks above moving averages
• New highs vs new lows
Those are useful.
But they do not measure how relationships between market components are changing.
Two markets can both have 8 bullish sectors.
One may be tightly connected and behaving as a coherent market.
The other may contain several disconnected clusters with very weak relationships.
Graph analysis can distinguish between those structures.
Practical Use
Market Network Confirmation can be used as a second layer of analysis when evaluating:
• Breakouts
• Trend continuation
• Rally quality
• Selloff confirmation
• Market breadth
• Sector rotation
• Internal divergence
• Recovery attempts
Research tool only. Not a standalone buy/sell signal.

Machine-learning market structure & forecast levels. Publishing levels before the markets move. Educational only.
Wyłączenie odpowiedzialności
Informacje i publikacje nie stanowią i nie powinny być traktowane jako porady finansowe, inwestycyjne, tradingowe ani jakiekolwiek inne rekomendacje dostarczane lub zatwierdzone przez TradingView. Więcej informacji znajduje się w Warunkach użytkowania.
Machine-learning market structure & forecast levels. Publishing levels before the markets move. Educational only.
Wyłączenie odpowiedzialności
Informacje i publikacje nie stanowią i nie powinny być traktowane jako porady finansowe, inwestycyjne, tradingowe ani jakiekolwiek inne rekomendacje dostarczane lub zatwierdzone przez TradingView. Więcej informacji znajduje się w Warunkach użytkowania.