OPEN-SOURCE SCRIPT
Al Brooks H2/L2 MTF Pro Engine
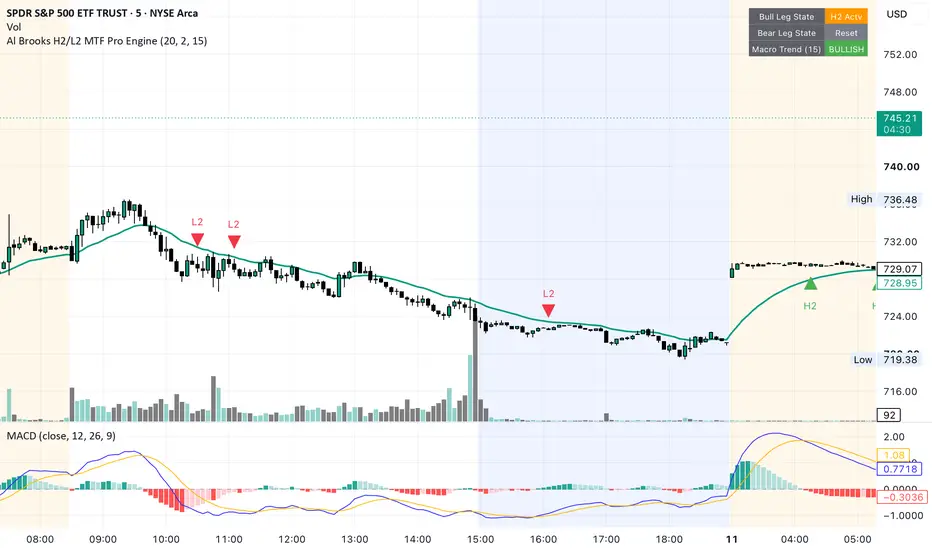
The Al Brooks H2/L2 MTF Pro Engine is an institutional price-action indicator designed to automate the visual tracking of two-legged trend pullbacks. Instead of cluttering your chart with lagging oscillators, it focuses entirely on raw candlestick geometry, market structure traps, and higher-timeframe trend alignment.
Here is a comprehensive breakdown of how the engine operates underneath the hood and exactly how to integrate it into your daily execution workflow.
Core Functionality: The Engineering
The script acts as a strict mathematical filter, requiring price action to pass through five distinct operational "gates" before printing an execution signal on your chart.
1. The Two-Legged Tracking Loop
The market moves in structural waves. During a pullback against a dominant trend, the first attempt by counter-trend traders to push the market back in the original direction is called a High 1 (H1) or Low 1 (L1). Algorithms and institutional players frequently trap these early entrants.
The script silently logs the H1/L1, waits for a failure or pause, and only triggers a signal when a High 2 (H2) or Low 2 (L2) forms. This indicates that counter-trend traders are covering their positions and the dominant institutional trend is resuming.
2. The Non-Repainting MTF Filter
The script runs an internal dual-engine check. While tracking the microscopic price action on your execution chart (e.g., the 5-minute), it simultaneously watches a designated higher timeframe (the 15-minute by default).
It will completely suppress 5m H2 Buy signals if the 15m candle is trading below its own 20 EMA.
It uses secure, historical index offsets to ensure that historical signals on your chart never shift, vanish, or "repaint" after the bar closes.
3. Structural Reset Logic
To prevent false signals during choppy, directionless consolidation, the counting engine automatically flushes its memory cache back to zero if:
Price cleanly crosses to the wrong side of the 5-minute 20 EMA.
Price prints a brand-new, structural 20-bar macro high or low, signaling that a completely new trend leg has begun.
4. The Al Brooks "Trend Bar" Mandate
Not all breakout bars are created equal. The engine analyzes the internal construction of the trigger candle. For an H2 Buy to be valid, the candle must close in the top 33% of its total high-to-low range. For an L2 Sell, it must close in the bottom 33%. This ensures you only enter when real, intraday momentum is actively defending the moving average.
📊 Reading the Chart Visuals
When the engine identifies a verified setup, it cleans up your visual space by displaying information in three distinct layers:
The Live Dashboard (Top Right): Displays the current internal leg state of the market in real-time ("Reset", "Waiting H2", etc.) alongside a dynamic macro trend status flag.
The Trigger Icon: Plots a sharp, small green or red triangle directly at the bar location, keeping your 5-minute candles completely scannable.
The Risk Projections: Instantly projects three colored lines forward for 5 bars: a dashed blue entry line (1 tick above/below the signal bar), a solid red stop-loss floor (1 tick outside the signal bar's extreme), and a solid green target line mathematically set to a precise 1:2 risk-to-reward ratio.
⚡ How to Make Use of It in Real-Time
To maximize this script alongside your core asset watchlists (SPY, QQQ, and mega-caps), execute your morning preparation using this step-by-step framework:
Step 1: The Morning Filter
Let the opening bell ring at 09:30 AM CDT. Do not look for setups immediately. Let the market algorithms process opening order flows and flatten out early premium implied volatility (IV). Keep your eyes on the dashboard; you want to see a clear macro trend direction establish itself by 09:50 AM CDT.
Step 2: The Proximity Watch
Once a clear macro trend is confirmed by the dashboard, wait for the index to initiate a pullback. You are looking for a gentle drift back toward the teal 20 EMA line. The script will handle the micro counting for you as the candles form.
Step 3: Visual Risk Pre-Sizing
The exact moment a compact H2 or L2 label prints on a closing candle:
Freeze your chart analysis and look at the projected Blue and Red lines.
Measure the physical distance between them. If you are preparing an option contract execution inside ThinkOrSwim, that distance tells you your exact structural dollar risk.
If the distance is wider than normal due to a large signal candle, immediately downsize your contract position sizing to perfectly protect your daily loss threshold.
Step 4: Bracket Order Execution
Do not enter at market price. Place a Buy Stop order on your broker platform exactly at the price level indicated by the blue dashed line.
If the next candle immediately breaks that high, you are automatically swept into the trade with momentum.
If price turns around instead and falls, your entry order is never triggered, completely protecting your capital from an unconfirmed trap.
Once filled, immediately attach your OCO bracket matching the red stop and green target prices projected on your screen.
Here is a comprehensive breakdown of how the engine operates underneath the hood and exactly how to integrate it into your daily execution workflow.
Core Functionality: The Engineering
The script acts as a strict mathematical filter, requiring price action to pass through five distinct operational "gates" before printing an execution signal on your chart.
1. The Two-Legged Tracking Loop
The market moves in structural waves. During a pullback against a dominant trend, the first attempt by counter-trend traders to push the market back in the original direction is called a High 1 (H1) or Low 1 (L1). Algorithms and institutional players frequently trap these early entrants.
The script silently logs the H1/L1, waits for a failure or pause, and only triggers a signal when a High 2 (H2) or Low 2 (L2) forms. This indicates that counter-trend traders are covering their positions and the dominant institutional trend is resuming.
2. The Non-Repainting MTF Filter
The script runs an internal dual-engine check. While tracking the microscopic price action on your execution chart (e.g., the 5-minute), it simultaneously watches a designated higher timeframe (the 15-minute by default).
It will completely suppress 5m H2 Buy signals if the 15m candle is trading below its own 20 EMA.
It uses secure, historical index offsets to ensure that historical signals on your chart never shift, vanish, or "repaint" after the bar closes.
3. Structural Reset Logic
To prevent false signals during choppy, directionless consolidation, the counting engine automatically flushes its memory cache back to zero if:
Price cleanly crosses to the wrong side of the 5-minute 20 EMA.
Price prints a brand-new, structural 20-bar macro high or low, signaling that a completely new trend leg has begun.
4. The Al Brooks "Trend Bar" Mandate
Not all breakout bars are created equal. The engine analyzes the internal construction of the trigger candle. For an H2 Buy to be valid, the candle must close in the top 33% of its total high-to-low range. For an L2 Sell, it must close in the bottom 33%. This ensures you only enter when real, intraday momentum is actively defending the moving average.
📊 Reading the Chart Visuals
When the engine identifies a verified setup, it cleans up your visual space by displaying information in three distinct layers:
The Live Dashboard (Top Right): Displays the current internal leg state of the market in real-time ("Reset", "Waiting H2", etc.) alongside a dynamic macro trend status flag.
The Trigger Icon: Plots a sharp, small green or red triangle directly at the bar location, keeping your 5-minute candles completely scannable.
The Risk Projections: Instantly projects three colored lines forward for 5 bars: a dashed blue entry line (1 tick above/below the signal bar), a solid red stop-loss floor (1 tick outside the signal bar's extreme), and a solid green target line mathematically set to a precise 1:2 risk-to-reward ratio.
⚡ How to Make Use of It in Real-Time
To maximize this script alongside your core asset watchlists (SPY, QQQ, and mega-caps), execute your morning preparation using this step-by-step framework:
Step 1: The Morning Filter
Let the opening bell ring at 09:30 AM CDT. Do not look for setups immediately. Let the market algorithms process opening order flows and flatten out early premium implied volatility (IV). Keep your eyes on the dashboard; you want to see a clear macro trend direction establish itself by 09:50 AM CDT.
Step 2: The Proximity Watch
Once a clear macro trend is confirmed by the dashboard, wait for the index to initiate a pullback. You are looking for a gentle drift back toward the teal 20 EMA line. The script will handle the micro counting for you as the candles form.
Step 3: Visual Risk Pre-Sizing
The exact moment a compact H2 or L2 label prints on a closing candle:
Freeze your chart analysis and look at the projected Blue and Red lines.
Measure the physical distance between them. If you are preparing an option contract execution inside ThinkOrSwim, that distance tells you your exact structural dollar risk.
If the distance is wider than normal due to a large signal candle, immediately downsize your contract position sizing to perfectly protect your daily loss threshold.
Step 4: Bracket Order Execution
Do not enter at market price. Place a Buy Stop order on your broker platform exactly at the price level indicated by the blue dashed line.
If the next candle immediately breaks that high, you are automatically swept into the trade with momentum.
If price turns around instead and falls, your entry order is never triggered, completely protecting your capital from an unconfirmed trap.
Once filled, immediately attach your OCO bracket matching the red stop and green target prices projected on your screen.
Skrypt open-source
W zgodzie z duchem TradingView twórca tego skryptu udostępnił go jako open-source, aby użytkownicy mogli przejrzeć i zweryfikować jego działanie. Ukłony dla autora. Korzystanie jest bezpłatne, jednak ponowna publikacja kodu podlega naszym Zasadom serwisu.

Wyłączenie odpowiedzialności
Informacje i publikacje nie stanowią i nie powinny być traktowane jako porady finansowe, inwestycyjne, tradingowe ani jakiekolwiek inne rekomendacje dostarczane lub zatwierdzone przez TradingView. Więcej informacji znajduje się w Warunkach użytkowania.
Skrypt open-source
W zgodzie z duchem TradingView twórca tego skryptu udostępnił go jako open-source, aby użytkownicy mogli przejrzeć i zweryfikować jego działanie. Ukłony dla autora. Korzystanie jest bezpłatne, jednak ponowna publikacja kodu podlega naszym Zasadom serwisu.
Wyłączenie odpowiedzialności
Informacje i publikacje nie stanowią i nie powinny być traktowane jako porady finansowe, inwestycyjne, tradingowe ani jakiekolwiek inne rekomendacje dostarczane lub zatwierdzone przez TradingView. Więcej informacji znajduje się w Warunkach użytkowania.