OPEN-SOURCE SCRIPT
MSX Harmonic Pro
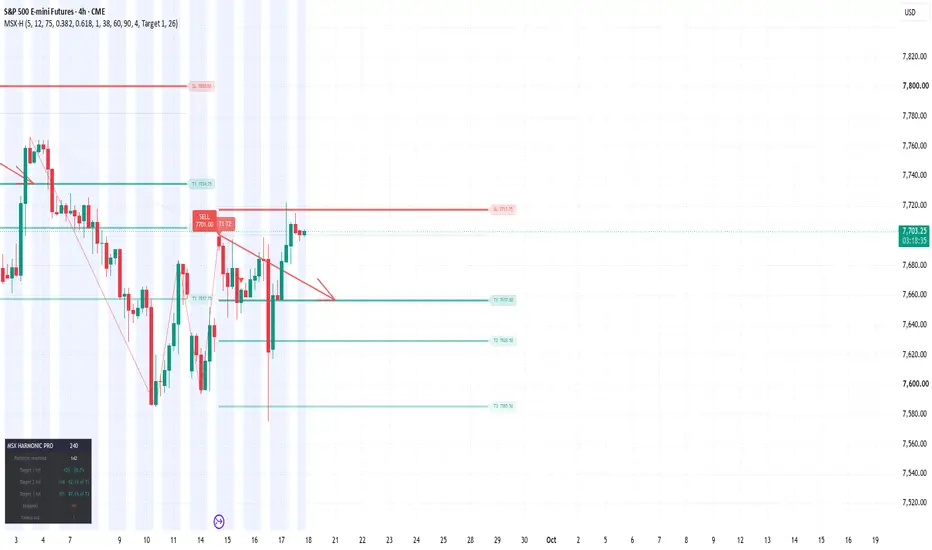
MSX HARMONIC PRO — XABCD Pattern Detection with Scored Entries and 3 Targets
OVERVIEW
MSX Harmonic Pro detects five-point XABCD harmonic patterns, scores each one on how closely its legs match the ideal Fibonacci proportions, and projects a complete trade plan from the completion point: entry, stop loss, and three take-profit levels drawn as horizontal price lines.
Every pattern is then tracked to resolution. The stats table reports the measured hit rate for each target on your symbol and timeframe — not a claimed rate, but what actually happened on the chart in front of you.
Nothing else is plotted. No moving averages, no oscillators, no bands, no fills.
HOW IT WORKS
PIVOT LADDER Swing highs and lows are detected with a configurable pivot length and pushed into an alternating ladder. When two consecutive pivots are the same type, only the more extreme one is retained, so the X-A-B-C-D sequence always alternates direction and never collapses into noise.
PATTERN MATCHING Each new five-pivot sequence is measured against six harmonic types:
Gartley AB/XA 0.618 · BC/AB 0.382-0.886 · CD/BC 1.13-1.618 · AD/XA 0.786 Bat AB/XA 0.382-0.5 · BC/AB 0.382-0.886 · CD/BC 1.618-2.618 · AD/XA 0.886 Butterfly AB/XA 0.786 · BC/AB 0.382-0.886 · CD/BC 1.618-2.24 · AD/XA 1.27-1.618 Crab AB/XA 0.382-0.618 · BC/AB 0.382-0.886 · CD/BC 2.618-3.618 · AD/XA 1.618 Shark AB/XA 0.382-0.618 · BC/AB 1.13-1.618 · CD/XC 0.886 Cypher AB/XA 0.382-0.618 · BC/AB 1.13-1.414 · CD/XC 0.786
Ratios defined as a single value are scored by proportional distance from that value. Ratios defined as a range score zero error anywhere inside the range and are penalised only for how far outside it they fall. The four leg errors are averaged and converted to a 0-100 score, where 100 is a geometrically perfect pattern. The best-scoring type wins the sequence; patterns below your minimum score are discarded and never drawn.
TRADE LEVELS Entry the D point, drawn as a grey dotted line Stop a percentage of the D-to-T1 distance placed beyond D, drawn as a thick red line Target 1 0.382 of the AD leg, measured back from D Target 2 0.618 of the AD leg Target 3 1.000 of the AD leg — a full retracement, which lands at point A
All four extend to the right of D and carry a price-tagged label.
PROJECTION ARROW A drawn arrow runs from the D point to your chosen target, showing the measured move the pattern's geometry implies. Select T1, T2 or T3 as the destination.
OUTCOME TRACKING Targets must be reached in order — T2 only registers after T1, T3 only after T2 — so a candle that spans several levels at once does not inflate the record. The score label at D builds up as the trade resolves:
82.4 still open 82.4 T1 reached target 1 82.4 T1 T2 T3 reached all three 82.4 X stopped out
Patterns that neither hit T1 nor stop within the timeout period are recorded separately as timed out and excluded from the hit rate.
STATS TABLE Patterns resolved completed trades with a definite outcome Target 1 hit count and percentage of resolved patterns Target 2 hit count and percentage of patterns that reached T1 Target 3 hit count and percentage of patterns that reached T2 Stopped count of losses Timed out expired without resolution
SETTINGS
PATTERNS Pivot length swing sensitivity. Lower finds more, smaller patterns. Allowed fib error % how far a ratio may deviate and still qualify. Minimum pattern score the main quality filter. Raise it for fewer, cleaner setups. Pattern toggles enable or disable each of the six types, and each direction.
ENTRY / STOP / TARGETS Target 1 / 2 / 3 Fibonacci multiples of the AD leg. Stop percentage of the D-to-T1 distance, placed beyond D. Level length how far the price lines extend right of D. Pattern timeout bars before an unresolved pattern expires. Patterns tracked how many run concurrently.
PROJECTION ARROW Arrow points to T1, T2 or T3. Arrow length horizontal reach in bars.
SIGNALS Buy / Sell labels at D, with the completion price shown on the label.
HOW TO USE IT
Start with the defaults and let the stats table fill on your symbol and timeframe. The three rates read together tell you where patterns stop working: if T1 converts well but T2-to-T3 conversion is weak, close the remainder at T2 rather than holding for a target the market is not reaching.
Minimum pattern score is the dial that matters. Raising it reduces signal count and raises average quality. Lower pivot length for intraday charts, higher for swing.
Harmonic completion points are reversal zones, not guarantees. The script is a structure and level tool — it identifies where a reversal is geometrically expected and what the measured move would be if it happens. Combine it with your own read of trend, session and higher-timeframe context.
ON THE SCORE
The number at the D point is Fibonacci ratio accuracy — how closely that pattern's legs match the textbook proportions of its type. It is a measure of geometric quality, not a probability of success. A 95-scoring pattern is a well-formed pattern; it can still fail. The stats table is the separate and more useful number, because it reports what actually happened rather than how good the shape looked.
NOTES
Original implementation. Pattern detection, scoring, level projection and outcome tracking are written from scratch — no external libraries, no reused code.
Harmonic pattern theory itself is public domain, developed through the work of H.M. Gartley, Larry Pesavento and Scott Carney.
This indicator is a technical analysis tool for study and planning. It is not financial advice and does not predict future price movement. Trading carries substantial risk of loss. Test any approach thoroughly before committing capital.
OVERVIEW
MSX Harmonic Pro detects five-point XABCD harmonic patterns, scores each one on how closely its legs match the ideal Fibonacci proportions, and projects a complete trade plan from the completion point: entry, stop loss, and three take-profit levels drawn as horizontal price lines.
Every pattern is then tracked to resolution. The stats table reports the measured hit rate for each target on your symbol and timeframe — not a claimed rate, but what actually happened on the chart in front of you.
Nothing else is plotted. No moving averages, no oscillators, no bands, no fills.
HOW IT WORKS
PIVOT LADDER Swing highs and lows are detected with a configurable pivot length and pushed into an alternating ladder. When two consecutive pivots are the same type, only the more extreme one is retained, so the X-A-B-C-D sequence always alternates direction and never collapses into noise.
PATTERN MATCHING Each new five-pivot sequence is measured against six harmonic types:
Gartley AB/XA 0.618 · BC/AB 0.382-0.886 · CD/BC 1.13-1.618 · AD/XA 0.786 Bat AB/XA 0.382-0.5 · BC/AB 0.382-0.886 · CD/BC 1.618-2.618 · AD/XA 0.886 Butterfly AB/XA 0.786 · BC/AB 0.382-0.886 · CD/BC 1.618-2.24 · AD/XA 1.27-1.618 Crab AB/XA 0.382-0.618 · BC/AB 0.382-0.886 · CD/BC 2.618-3.618 · AD/XA 1.618 Shark AB/XA 0.382-0.618 · BC/AB 1.13-1.618 · CD/XC 0.886 Cypher AB/XA 0.382-0.618 · BC/AB 1.13-1.414 · CD/XC 0.786
Ratios defined as a single value are scored by proportional distance from that value. Ratios defined as a range score zero error anywhere inside the range and are penalised only for how far outside it they fall. The four leg errors are averaged and converted to a 0-100 score, where 100 is a geometrically perfect pattern. The best-scoring type wins the sequence; patterns below your minimum score are discarded and never drawn.
TRADE LEVELS Entry the D point, drawn as a grey dotted line Stop a percentage of the D-to-T1 distance placed beyond D, drawn as a thick red line Target 1 0.382 of the AD leg, measured back from D Target 2 0.618 of the AD leg Target 3 1.000 of the AD leg — a full retracement, which lands at point A
All four extend to the right of D and carry a price-tagged label.
PROJECTION ARROW A drawn arrow runs from the D point to your chosen target, showing the measured move the pattern's geometry implies. Select T1, T2 or T3 as the destination.
OUTCOME TRACKING Targets must be reached in order — T2 only registers after T1, T3 only after T2 — so a candle that spans several levels at once does not inflate the record. The score label at D builds up as the trade resolves:
82.4 still open 82.4 T1 reached target 1 82.4 T1 T2 T3 reached all three 82.4 X stopped out
Patterns that neither hit T1 nor stop within the timeout period are recorded separately as timed out and excluded from the hit rate.
STATS TABLE Patterns resolved completed trades with a definite outcome Target 1 hit count and percentage of resolved patterns Target 2 hit count and percentage of patterns that reached T1 Target 3 hit count and percentage of patterns that reached T2 Stopped count of losses Timed out expired without resolution
SETTINGS
PATTERNS Pivot length swing sensitivity. Lower finds more, smaller patterns. Allowed fib error % how far a ratio may deviate and still qualify. Minimum pattern score the main quality filter. Raise it for fewer, cleaner setups. Pattern toggles enable or disable each of the six types, and each direction.
ENTRY / STOP / TARGETS Target 1 / 2 / 3 Fibonacci multiples of the AD leg. Stop percentage of the D-to-T1 distance, placed beyond D. Level length how far the price lines extend right of D. Pattern timeout bars before an unresolved pattern expires. Patterns tracked how many run concurrently.
PROJECTION ARROW Arrow points to T1, T2 or T3. Arrow length horizontal reach in bars.
SIGNALS Buy / Sell labels at D, with the completion price shown on the label.
HOW TO USE IT
Start with the defaults and let the stats table fill on your symbol and timeframe. The three rates read together tell you where patterns stop working: if T1 converts well but T2-to-T3 conversion is weak, close the remainder at T2 rather than holding for a target the market is not reaching.
Minimum pattern score is the dial that matters. Raising it reduces signal count and raises average quality. Lower pivot length for intraday charts, higher for swing.
Harmonic completion points are reversal zones, not guarantees. The script is a structure and level tool — it identifies where a reversal is geometrically expected and what the measured move would be if it happens. Combine it with your own read of trend, session and higher-timeframe context.
ON THE SCORE
The number at the D point is Fibonacci ratio accuracy — how closely that pattern's legs match the textbook proportions of its type. It is a measure of geometric quality, not a probability of success. A 95-scoring pattern is a well-formed pattern; it can still fail. The stats table is the separate and more useful number, because it reports what actually happened rather than how good the shape looked.
NOTES
Original implementation. Pattern detection, scoring, level projection and outcome tracking are written from scratch — no external libraries, no reused code.
Harmonic pattern theory itself is public domain, developed through the work of H.M. Gartley, Larry Pesavento and Scott Carney.
This indicator is a technical analysis tool for study and planning. It is not financial advice and does not predict future price movement. Trading carries substantial risk of loss. Test any approach thoroughly before committing capital.
Skrypt open-source
W zgodzie z duchem TradingView twórca tego skryptu udostępnił go jako open-source, aby użytkownicy mogli przejrzeć i zweryfikować jego działanie. Ukłony dla autora. Korzystanie jest bezpłatne, jednak ponowna publikacja kodu podlega naszym Zasadom serwisu.

Wyłączenie odpowiedzialności
Informacje i publikacje nie stanowią i nie powinny być traktowane jako porady finansowe, inwestycyjne, tradingowe ani jakiekolwiek inne rekomendacje dostarczane lub zatwierdzone przez TradingView. Więcej informacji znajduje się w Warunkach użytkowania.
Skrypt open-source
W zgodzie z duchem TradingView twórca tego skryptu udostępnił go jako open-source, aby użytkownicy mogli przejrzeć i zweryfikować jego działanie. Ukłony dla autora. Korzystanie jest bezpłatne, jednak ponowna publikacja kodu podlega naszym Zasadom serwisu.
Wyłączenie odpowiedzialności
Informacje i publikacje nie stanowią i nie powinny być traktowane jako porady finansowe, inwestycyjne, tradingowe ani jakiekolwiek inne rekomendacje dostarczane lub zatwierdzone przez TradingView. Więcej informacji znajduje się w Warunkach użytkowania.