CTZ Whale vs Retail Flow - Multi Alt-Coin
CTZ Whale vs Retail Flow - Multi Coin
OVERVIEW
One indicator for every coin. It automatically detects the coin on your chart and builds all exchange, premium and open interest symbols from it — switch from BTC to ETH, SOL, PAXG or any altcoin and it follows instantly. No settings to change.
It separates heavy-volume activity (whales) from normal-volume activity (retail) and shows whether each side is net buying or net selling, directly on the price chart.
• Bottoms form when retail is shaken out (selling) while whales absorb it (buying).
• Tops form when retail chases (buying) while whales distribute into it (selling).
Every signal must be backed by independent confirmation from a premium (Coinbase or gold) and/or open interest.
HOW IT WORKS
1. Auto coin detection
The coin is read from the chart symbol (e.g. SOL from SOLUSDT or SOLUSDT.P). The indicator then uses:
• Spot volume: Binance, Coinbase, OKX and Bybit
• Premium: Coinbase vs Binance (or spot gold for PAXG / XAUT)
• Open interest: Binance perpetual
Exchanges that don't list the coin are skipped automatically.
2. Aggregated spot volume
Each chart candle is broken into lower-timeframe candles (1m up to 1H charts, 5m for 2H–4H, 15m for 5H–1D, 60m above 1D) from every exchange that lists the coin.
3. Whale vs retail split
Any intrabar candle with volume at least 10x the normal intrabar volume is classed as whale activity; everything else is retail. Each candle's volume is split into buying and selling based on where it closed within its range.
4. Three-part confirmation score
• Whale flow (required): whale strength above +0.5 while retail sells (buy), or below -0.5 while retail buys (sell). Strength is measured against its own history, so it adapts to any coin and timeframe.
• Premium:
– Coinbase premium (default for most coins): Coinbase above Binance = US buyers paying up (buy). Below = US demand absent (sell).
– Gold premium (auto for PAXG / XAUT): token price vs spot gold, compared with its own average. Above average = buyers paying up (buy). Below = selling pressure (sell).
• Open interest: OI 3%+ below its recent peak = longs flushed (buy). OI 3%+ above its recent low = leverage piling in (sell). Doubles to 6% on daily and above.
A signal needs whale flow plus at least one confirmation (2/3 by default).
WHAT YOU SEE ON THE CHART
• WHALE BUY x/3 – whales buying, retail selling, near a recent low, confirmed.
• WHALE SELL x/3 – whales selling, retail buying, near a recent high, confirmed.
• Red candle painted bright green – price fell but whales were heavily net buying (hidden accumulation).
• Green candle painted bright red – price rose but whales were heavily net selling (hidden distribution).
• Green / red background – confirmed accumulation / distribution zone. Darker shading = 3/3.
LOW LEVELS (LINES)
Plotted for the chart timeframe plus two higher timeframes (default 4H and 1D):
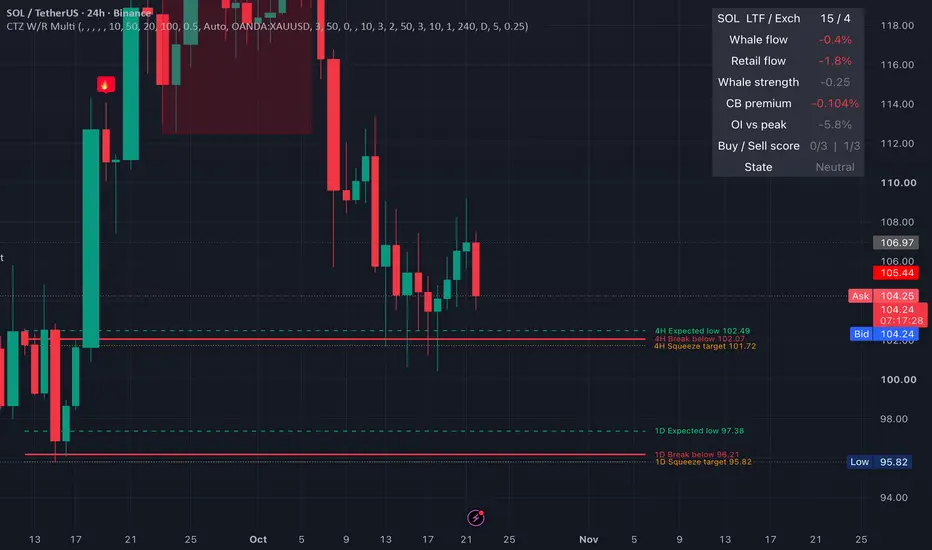
• Expected low (green dashed) – nearest swing low below price, where a bottom usually forms.
• Break below (red solid) – expected low minus 0.25 x ATR. A close below means the low is breaking.
• Squeeze target (orange dotted) – next swing low below, where a long squeeze is likely to run.
Levels stay in place while price tests them and only roll down once a close breaks them. Prices are shown in the coin's own decimals.
DASHBOARD
• Coin / LTF / Exch – detected coin, lower timeframe in use and number of exchanges loading.
• Whale flow / Retail flow – net buying (+) or selling (-) as % of volume over the last 20 bars.
• Whale strength – above +0.5 strong buying, below -0.5 strong selling.
• CB premium or Gold premium – depending on the coin. Shows n/a if the coin is not on Coinbase.
• OI vs peak – 0% = leverage at its high, -3% or lower = flush. Shows n/a if there is no Binance perpetual.
• Buy / Sell score and State – ACCUMULATION, DISTRIBUTION or Neutral.
HOW TO USE IT
Use the daily (or 22H) for direction and the 4H for entries. Only take 4H signals that agree with the higher timeframe. Do not take longs while the higher timeframe shows DISTRIBUTION.
Bottom checklist: retail flow negative, OI flushed 3%+ (6%+ daily), whale strength turning up through +0.5, premium turning green, a sweep of the expected low with a bright-green candle.
Top checklist: retail flow positive, OI at its peak, whale strength below -0.5, premium red, price at supply.
Wait for the candle to close. Set alerts to "Once Per Bar Close".
SETTINGS
• Exchanges – tick or untick Binance, Coinbase, OKX, Bybit. Leave the boxes blank for auto, or type EXCHANGE:TICKER to force a specific pair.
• Premium type – Auto, Coinbase, Gold or Off.
• OI symbol – blank for auto (BINANCE:<COIN>USDT.P_OI), or type your own.
• Whale size (default 10x) – lower to 5–6 for smaller altcoins with thinner volume.
• Whale zone / candle sensitivity – raise for fewer signals.
• Min score to signal (2) – set to 3 for the cleanest signals.
• Low Levels – swing strength, break buffer and the two extra timeframes.
ALERTS
Whale buy (confirmed), Whale sell (confirmed), Red candle whales buying, Green candle whales selling, Breaking low, Low swept, Broken low reclaimed.
BEST USED ON
USDT spot or perpetual charts of coins listed on major exchanges. Works best on liquid coins; on small caps fewer exchanges and checks may be available.
LIMITATIONS
• TradingView provides candles, not individual trades. A "whale" is an intrabar candle with abnormal volume, which may be one large order or many arriving together.
• Buy/sell split is estimated from candle structure, not trade-by-trade aggressor data.
• Coins not on Coinbase have no premium check; coins without a Binance perpetual have no OI check. Signals then rely on the remaining checks.
• Spot gold does not trade at weekends, so the gold premium holds its last weekday value.
• Lower-timeframe history is limited, so higher timeframes reach back a shorter distance.
This indicator is a tool for reading order flow and is not financial advice. Always use your own risk management.
OVERVIEW
One indicator for every coin. It automatically detects the coin on your chart and builds all exchange, premium and open interest symbols from it — switch from BTC to ETH, SOL, PAXG or any altcoin and it follows instantly. No settings to change.
It separates heavy-volume activity (whales) from normal-volume activity (retail) and shows whether each side is net buying or net selling, directly on the price chart.
• Bottoms form when retail is shaken out (selling) while whales absorb it (buying).
• Tops form when retail chases (buying) while whales distribute into it (selling).
Every signal must be backed by independent confirmation from a premium (Coinbase or gold) and/or open interest.
HOW IT WORKS
1. Auto coin detection
The coin is read from the chart symbol (e.g. SOL from SOLUSDT or SOLUSDT.P). The indicator then uses:
• Spot volume: Binance, Coinbase, OKX and Bybit
• Premium: Coinbase vs Binance (or spot gold for PAXG / XAUT)
• Open interest: Binance perpetual
Exchanges that don't list the coin are skipped automatically.
2. Aggregated spot volume
Each chart candle is broken into lower-timeframe candles (1m up to 1H charts, 5m for 2H–4H, 15m for 5H–1D, 60m above 1D) from every exchange that lists the coin.
3. Whale vs retail split
Any intrabar candle with volume at least 10x the normal intrabar volume is classed as whale activity; everything else is retail. Each candle's volume is split into buying and selling based on where it closed within its range.
4. Three-part confirmation score
• Whale flow (required): whale strength above +0.5 while retail sells (buy), or below -0.5 while retail buys (sell). Strength is measured against its own history, so it adapts to any coin and timeframe.
• Premium:
– Coinbase premium (default for most coins): Coinbase above Binance = US buyers paying up (buy). Below = US demand absent (sell).
– Gold premium (auto for PAXG / XAUT): token price vs spot gold, compared with its own average. Above average = buyers paying up (buy). Below = selling pressure (sell).
• Open interest: OI 3%+ below its recent peak = longs flushed (buy). OI 3%+ above its recent low = leverage piling in (sell). Doubles to 6% on daily and above.
A signal needs whale flow plus at least one confirmation (2/3 by default).
WHAT YOU SEE ON THE CHART
• WHALE BUY x/3 – whales buying, retail selling, near a recent low, confirmed.
• WHALE SELL x/3 – whales selling, retail buying, near a recent high, confirmed.
• Red candle painted bright green – price fell but whales were heavily net buying (hidden accumulation).
• Green candle painted bright red – price rose but whales were heavily net selling (hidden distribution).
• Green / red background – confirmed accumulation / distribution zone. Darker shading = 3/3.
LOW LEVELS (LINES)
Plotted for the chart timeframe plus two higher timeframes (default 4H and 1D):
• Expected low (green dashed) – nearest swing low below price, where a bottom usually forms.
• Break below (red solid) – expected low minus 0.25 x ATR. A close below means the low is breaking.
• Squeeze target (orange dotted) – next swing low below, where a long squeeze is likely to run.
Levels stay in place while price tests them and only roll down once a close breaks them. Prices are shown in the coin's own decimals.
DASHBOARD
• Coin / LTF / Exch – detected coin, lower timeframe in use and number of exchanges loading.
• Whale flow / Retail flow – net buying (+) or selling (-) as % of volume over the last 20 bars.
• Whale strength – above +0.5 strong buying, below -0.5 strong selling.
• CB premium or Gold premium – depending on the coin. Shows n/a if the coin is not on Coinbase.
• OI vs peak – 0% = leverage at its high, -3% or lower = flush. Shows n/a if there is no Binance perpetual.
• Buy / Sell score and State – ACCUMULATION, DISTRIBUTION or Neutral.
HOW TO USE IT
Use the daily (or 22H) for direction and the 4H for entries. Only take 4H signals that agree with the higher timeframe. Do not take longs while the higher timeframe shows DISTRIBUTION.
Bottom checklist: retail flow negative, OI flushed 3%+ (6%+ daily), whale strength turning up through +0.5, premium turning green, a sweep of the expected low with a bright-green candle.
Top checklist: retail flow positive, OI at its peak, whale strength below -0.5, premium red, price at supply.
Wait for the candle to close. Set alerts to "Once Per Bar Close".
SETTINGS
• Exchanges – tick or untick Binance, Coinbase, OKX, Bybit. Leave the boxes blank for auto, or type EXCHANGE:TICKER to force a specific pair.
• Premium type – Auto, Coinbase, Gold or Off.
• OI symbol – blank for auto (BINANCE:<COIN>USDT.P_OI), or type your own.
• Whale size (default 10x) – lower to 5–6 for smaller altcoins with thinner volume.
• Whale zone / candle sensitivity – raise for fewer signals.
• Min score to signal (2) – set to 3 for the cleanest signals.
• Low Levels – swing strength, break buffer and the two extra timeframes.
ALERTS
Whale buy (confirmed), Whale sell (confirmed), Red candle whales buying, Green candle whales selling, Breaking low, Low swept, Broken low reclaimed.
BEST USED ON
USDT spot or perpetual charts of coins listed on major exchanges. Works best on liquid coins; on small caps fewer exchanges and checks may be available.
LIMITATIONS
• TradingView provides candles, not individual trades. A "whale" is an intrabar candle with abnormal volume, which may be one large order or many arriving together.
• Buy/sell split is estimated from candle structure, not trade-by-trade aggressor data.
• Coins not on Coinbase have no premium check; coins without a Binance perpetual have no OI check. Signals then rely on the remaining checks.
• Spot gold does not trade at weekends, so the gold premium holds its last weekday value.
• Lower-timeframe history is limited, so higher timeframes reach back a shorter distance.
This indicator is a tool for reading order flow and is not financial advice. Always use your own risk management.

Wyłączenie odpowiedzialności
Informacje i publikacje nie stanowią i nie powinny być traktowane jako porady finansowe, inwestycyjne, tradingowe ani jakiekolwiek inne rekomendacje dostarczane lub zatwierdzone przez TradingView. Więcej informacji znajduje się w Warunkach użytkowania.
Wyłączenie odpowiedzialności
Informacje i publikacje nie stanowią i nie powinny być traktowane jako porady finansowe, inwestycyjne, tradingowe ani jakiekolwiek inne rekomendacje dostarczane lub zatwierdzone przez TradingView. Więcej informacji znajduje się w Warunkach użytkowania.