Zaktualizowano
FCP | HL Levels | Daily Weekly Monthly Multi Timeframe High Low
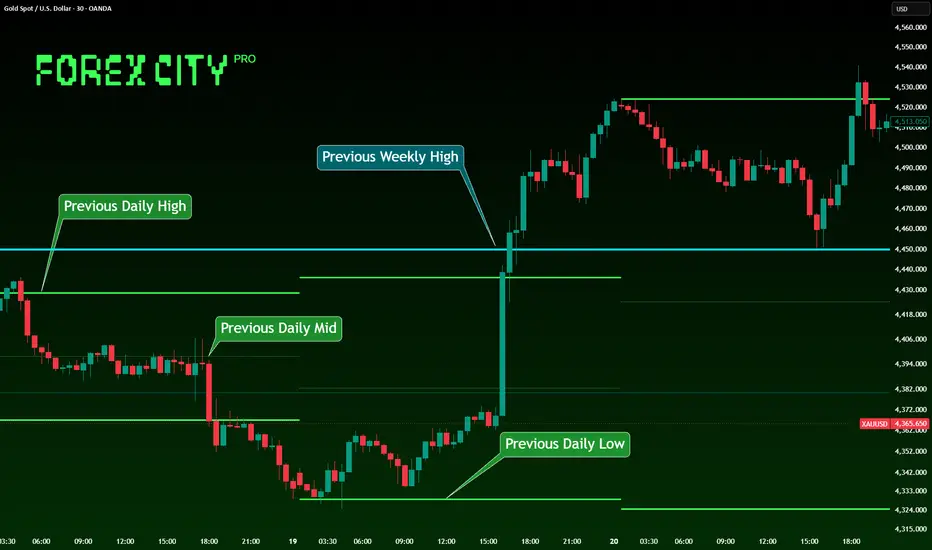
HL Levels draws the high, low and midpoint of each completed higher-timeframe candle directly on your chart, so you can see where the market reacted without switching timeframes.
What it plots
For every closed candle of the selected timeframe, three horizontal segments are drawn across the range of that period:
High — the peak of the previous period
Low — the trough of the previous period
Midpoint — the 50% level between them, drawn as a dotted line
Each segment spans only its own period, so the chart reads as a sequence of ranges rather than a cluster of endless rays.
Timeframes
Three fixed groups are available out of the box:
Daily — previous day's high, low and midpoint
Weekly — previous week's high, low and midpoint
Monthly — previous month's high, low and midpoint
Each can be toggled independently and given its own colour and line width.
Custom timeframe
A fourth group lets you pick any timeframe you want. It is off by default. Turn it on, choose a timeframe, and set how many candles back to draw.
This is aimed at intraday traders who work on low timeframes but need a mid-level reference — for example a 5-minute chart showing 4-hour highs and lows. Its look-back is measured in candles, not days, because the timeframe is yours to choose and a day-based count would produce thousands of objects on a 1-minute setting.
Look-back
The three fixed groups share a single look-back measured in days (default 60). The indicator converts that into the right number of candles for each timeframe automatically, so one setting controls all three consistently.
Notes
A group is skipped when its timeframe is lower than the chart's own timeframe, since those levels would change faster than the bars drawn beneath them.
Higher-timeframe data is requested with lookahead_on applied to high[1] and low[1] — that is, only fully closed candles are read. Nothing repaints.
The script respects Pine's 500-line drawing budget. Older periods are removed as new ones form.
How to use it
Previous-period highs and lows are among the most watched levels in any market. Price approaching a prior daily high often meets sellers; a prior weekly low often attracts buyers. The midpoint marks the equilibrium of that period and frequently acts as support or resistance in its own right.
These are reference levels, not signals. Combine them with your own analysis and risk management.
What it plots
For every closed candle of the selected timeframe, three horizontal segments are drawn across the range of that period:
High — the peak of the previous period
Low — the trough of the previous period
Midpoint — the 50% level between them, drawn as a dotted line
Each segment spans only its own period, so the chart reads as a sequence of ranges rather than a cluster of endless rays.
Timeframes
Three fixed groups are available out of the box:
Daily — previous day's high, low and midpoint
Weekly — previous week's high, low and midpoint
Monthly — previous month's high, low and midpoint
Each can be toggled independently and given its own colour and line width.
Custom timeframe
A fourth group lets you pick any timeframe you want. It is off by default. Turn it on, choose a timeframe, and set how many candles back to draw.
This is aimed at intraday traders who work on low timeframes but need a mid-level reference — for example a 5-minute chart showing 4-hour highs and lows. Its look-back is measured in candles, not days, because the timeframe is yours to choose and a day-based count would produce thousands of objects on a 1-minute setting.
Look-back
The three fixed groups share a single look-back measured in days (default 60). The indicator converts that into the right number of candles for each timeframe automatically, so one setting controls all three consistently.
Notes
A group is skipped when its timeframe is lower than the chart's own timeframe, since those levels would change faster than the bars drawn beneath them.
Higher-timeframe data is requested with lookahead_on applied to high[1] and low[1] — that is, only fully closed candles are read. Nothing repaints.
The script respects Pine's 500-line drawing budget. Older periods are removed as new ones form.
How to use it
Previous-period highs and lows are among the most watched levels in any market. Price approaching a prior daily high often meets sellers; a prior weekly low often attracts buyers. The midpoint marks the equilibrium of that period and frequently acts as support or resistance in its own right.
These are reference levels, not signals. Combine them with your own analysis and risk management.
Informacje o Wersji
Renamed the indicator title for clarity.The old title did not make it clear that these are the previous
period's levels. The new title states it directly: previous day,
week and month high and low.
No changes to the logic, inputs or default values.
Informacje o Wersji
Chart snapshot updated 
Wyłączenie odpowiedzialności
Informacje i publikacje nie stanowią i nie powinny być traktowane jako porady finansowe, inwestycyjne, tradingowe ani jakiekolwiek inne rekomendacje dostarczane lub zatwierdzone przez TradingView. Więcej informacji znajduje się w Warunkach użytkowania.
Wyłączenie odpowiedzialności
Informacje i publikacje nie stanowią i nie powinny być traktowane jako porady finansowe, inwestycyjne, tradingowe ani jakiekolwiek inne rekomendacje dostarczane lub zatwierdzone przez TradingView. Więcej informacji znajduje się w Warunkach użytkowania.