Zaktualizowano
Dynamic Trend-Based Fibonacci Extension Pro [MarkitTick]
Get this and other exclusive indicators in MarkitTick
This indicator is part of MarkitTick's Paid Space. Subscribe for $43.75/month to use it on your charts along with the author's other exclusive indicators. You pay right on TradingView and get access straight away.
Explore MarkitTick💡 This advanced technical indicator implements a sophisticated, multi-layered framework for detecting and projecting Trend-Based Fibonacci Extensions through a dynamic lens. Unlike static tools, it automates the identification of high-probability A-B-C price structures across both local and higher timeframes, integrating volatility-adjusted swing detection with rigorous precision filters. It is designed for traders seeking a systematic approach to identifying institutional target zones, wave completion points, and high-quality retest opportunities with built-in risk-to-reward visualization.
This is the professional version of the free indicator Dynamic Trend-Based Fibonacci Extension
✨ Originality and Utility
The Dynamic Trend-Based Fibonacci Extension Pro stands apart from conventional charting tools by moving beyond simple point-and-click placement. Its primary originality lies in its adaptive nature and "state-aware" structure management:
● Adaptive Volatility Filtering
Traditional ZigZag and Fibonacci tools often fail during periods of changing volatility. This script utilizes an ATR-based threshold mechanism to dynamically adjust pivot detection sensitivity. This ensures that swing points are confirmed based on the current market environment rather than arbitrary fixed percentages.
● Retest Precision Engine
One of the most significant hurdles for traders is identifying when a broken structure remains valid for a retest. This script introduces a logic-gated "Retest Phase" that grays out invalidated structures and re-activates them only when specific high-conviction criteria are met, such as low-volume pullbacks or price rejection candles at Point C.
● Higher Timeframe (HTF) Confluence
The indicator provides a dual-layer perspective by projecting HTF Fibonacci levels directly onto the current chart. This allows traders to identify "Nested Structures"—where a local bullish setup aligns with a major HTF extension zone—dramatically increasing the statistical probability of the trade.
● Integrated Risk/Reward Visualizer
By calculating entry points at the breakout of Point B and placing stop-losses relative to Point C (with user-defined buffers), the script provides an immediate visual assessment of the trade's viability, including automated R:R ratio calculations.

🔬 Methodology and Concepts
The script operates through a sequential logic pipeline that ensures only structurally sound setups are displayed:
• Pivot Point Identification
The core uses a lookback depth algorithm to identify local Highs and Lows. For a point to be considered a "ZigZagPoint," it must represent a significant deviation defined by either a fixed percentage or an ATR multiplier. This eliminates market noise and focuses on structural impulses.
• The A-B-C Structural Logic
A bullish structure is defined as a sequence of a Low (A), a High (B), and a Higher-Low (C). Conversely, a bearish structure follows a High (A), a Low (B), and a Lower-High (C). The script validates that Point C has not breached the origin of Point A, ensuring a valid trend impulse exists.
• Fibonacci Extension Calculus
Extensions are calculated by measuring the distance between Point A and Point B, then projecting that distance from Point C. The formula used is:
Target = PriceC + ((PriceB - PriceA) * Ratio)
For instruments with extreme price ranges, such as Cryptocurrencies, the script offers a Logarithmic Scale mode, which calculates extensions based on the natural logs of the prices to maintain geometric accuracy.
• Validation Filters
🎨 Visual Guide
The visual output is highly organized to maintain chart clarity despite the complexity of the underlying data:
● Primary Structure Lines
● Fibonacci Extension Levels
● Retest and Invalidation Visuals
● Risk/Reward Zones
● Higher Timeframe (HTF) Elements
HTF structures are drawn with thicker lines (width 3) and use distinct colors (Cyan for Bullish, Orange for Bearish) to ensure they are not confused with local timeframe data. Labels are prefixed with "HTF" for immediate identification.

🔍 Deconstruction of the Underlying Scientific and Academic Framework
The indicator is built upon several pillars of quantitative finance and technical theory:
• Phidias and the Golden Ratio
The mathematical foundation is rooted in the Fibonacci sequence and the limit of its ratios, approximately 1.618. In financial markets, this ratio is used to model the "growth" of a price impulse, based on the observation that market cycles often expand in proportions found in nature.
• Volatility-Adjusted Thresholds (Statistical Deviation)
By using the Average True Range (ATR), the script applies the principles of statistical volatility. Instead of a linear threshold, it uses a non-linear filter that accounts for the standard "noise" of the asset. This is academically linked to the concept of the "Signal-to-Noise Ratio" in time-series analysis.
• Volume-Price Agreement (VSA)
The retest logic incorporates elements of Volume Spread Analysis. The requirement for low volume during a retest of Point C is based on the theory that if an impulse is to continue, the counter-trend move should exhibit a lack of supply (in bullish cases) or a lack of demand (in bearish cases).
• Logarithmic Growth Models
The inclusion of logarithmic extension calculations recognizes that price action in high-growth assets is often exponential rather than linear. By applying natural logarithms, the script treats price moves as percentage changes, which is the standard for long-term econometric modeling.
📖 How to Use

⚙️ Inputs and Settings
● ● ZigZag Detection
• Pivot Lookback Depth: Controls how many bars are required to confirm a high or low. Higher values find "major" trends; lower values find "scalping" setups.
• Use ATR-Based Threshold: Toggles between volatility-adjusted or fixed percentage swing detection.
● ● Retest Precision Filters
• Min Bars After Break: Prevents "instant" retests that are often just price volatility. Requires a gap between the break of C and the return to C.
• Low Volume on Retest: When enabled, the retest must occur on volume lower than the 20-bar average.
• Rejection Candle at C: Requires a Pin Bar or Engulfing candle to trigger an "Ideal Retest" status.
● ● Momentum & Trend Filters
• Enable RSI Filter: Filters for setups where Point C is at a momentum extreme.
• Enable Trend Baseline Filter: Uses a 200 EMA to ensure you are only trading in the direction of the long-term trend.
● ● Higher Timeframe
• Select Timeframe: Choose which HTF to pull data from (e.g., Daily for an Hourly chart). This displays the "Big Picture" extensions.
🔓 vs 🔒 Dynamic Trend-Based Fibonacci Extension (Pro vs. Free)
• Object-Oriented Optimization
Object-Oriented Optimization: The Pro version shifts from standard functional programming to advanced Object-Oriented Methods attached to User-Defined Types (UDTs). It also utilizes var-declared, pre-computed global arrays for Fibonacci ratios to drastically reduce per-bar memory allocation and processing overhead.
• Algorithmic Trade Validation
Algorithmic Trade Validation: Introduces institutional-grade confirmation layers, including a Trend Baseline Filter (EMA), RSI Momentum validation, and a Volume Spike identifier, ensuring structures are mathematically validated before generating signals.
• Precision Retest & Retracement Engine
Precision Retest & Retracement Engine: Upgrades basic structural invalidation with strict B-C retracement depth constraints (e.g., 0.382–0.886). It includes a dynamic Retest Engine that classifies pullbacks as "Ideal" or "Normal" using real-time volume analysis and wick-to-range candlestick rejection logic.
• Zero-Repaint MTF Integration
Zero-Repaint MTF Integration: Implements a Higher Timeframe (HTF) algorithmic overlay using strictly compliant request.security calls, anchored with [1] offsets and barmerge.lookahead_on to absolutely prevent repainting.
• Advanced Analytics UI
Advanced Analytics UI: Features a dynamic on-chart Dashboard Table for real-time statistical tracking, an algorithmic Anti-Overlap label engine to prevent visual clutter, and visual Risk/Reward (R:R) mapping for Entry, Stop Loss, and Take Profit zones.
• Institutional JSON Webhooks
Institutional JSON Webhooks: Alert payloads are engineered as strictly formatted JSON strings designed for automated execution (e.g., PineConnector, 3Commas), dynamically calculating and appending the precise Entry Price, Target Price (TP), and a buffered Invalidation Price (SL).
• Fibonacci Time Extensions
Fibonacci Time Extensions: Projects vertical time-based targets (e.g., 1.0, 1.618) derived from the A-B impulse duration to forecast temporal reversal zones alongside price targets.
⚠️ Disclaimer
All provided scripts and indicators are strictly for educational exploration and must not be interpreted as financial advice or a recommendation to execute trades. I expressly disclaim all liability for any financial losses or damages that may result, directly or indirectly, from the reliance on or application of these tools. Market participation carries inherent risk where past performance never guarantees future returns, leaving all investment decisions and due diligence solely at your own discretion.
This is the professional version of the free indicator Dynamic Trend-Based Fibonacci Extension
✨ Originality and Utility
The Dynamic Trend-Based Fibonacci Extension Pro stands apart from conventional charting tools by moving beyond simple point-and-click placement. Its primary originality lies in its adaptive nature and "state-aware" structure management:
● Adaptive Volatility Filtering
Traditional ZigZag and Fibonacci tools often fail during periods of changing volatility. This script utilizes an ATR-based threshold mechanism to dynamically adjust pivot detection sensitivity. This ensures that swing points are confirmed based on the current market environment rather than arbitrary fixed percentages.
● Retest Precision Engine
One of the most significant hurdles for traders is identifying when a broken structure remains valid for a retest. This script introduces a logic-gated "Retest Phase" that grays out invalidated structures and re-activates them only when specific high-conviction criteria are met, such as low-volume pullbacks or price rejection candles at Point C.
● Higher Timeframe (HTF) Confluence
The indicator provides a dual-layer perspective by projecting HTF Fibonacci levels directly onto the current chart. This allows traders to identify "Nested Structures"—where a local bullish setup aligns with a major HTF extension zone—dramatically increasing the statistical probability of the trade.
● Integrated Risk/Reward Visualizer
By calculating entry points at the breakout of Point B and placing stop-losses relative to Point C (with user-defined buffers), the script provides an immediate visual assessment of the trade's viability, including automated R:R ratio calculations.
🔬 Methodology and Concepts
The script operates through a sequential logic pipeline that ensures only structurally sound setups are displayed:
• Pivot Point Identification
The core uses a lookback depth algorithm to identify local Highs and Lows. For a point to be considered a "ZigZagPoint," it must represent a significant deviation defined by either a fixed percentage or an ATR multiplier. This eliminates market noise and focuses on structural impulses.
• The A-B-C Structural Logic
A bullish structure is defined as a sequence of a Low (A), a High (B), and a Higher-Low (C). Conversely, a bearish structure follows a High (A), a Low (B), and a Lower-High (C). The script validates that Point C has not breached the origin of Point A, ensuring a valid trend impulse exists.
• Fibonacci Extension Calculus
Extensions are calculated by measuring the distance between Point A and Point B, then projecting that distance from Point C. The formula used is:
Target = PriceC + ((PriceB - PriceA) * Ratio)
For instruments with extreme price ranges, such as Cryptocurrencies, the script offers a Logarithmic Scale mode, which calculates extensions based on the natural logs of the prices to maintain geometric accuracy.
• Validation Filters
- Trend Filter: Point C must align with the direction of a 200-period EMA.
- Momentum Filter: Utilizes the RSI to ensure Point C is occurring at an overbought/oversold extreme.
- Volume Filter: Requires a volume spike at the pivot to confirm institutional participation.
- Retracement Depth: Ensures the B-C move is between 38.2% and 88.6% of the A-B impulse to prevent shallow or over-extended setups.
🎨 Visual Guide
The visual output is highly organized to maintain chart clarity despite the complexity of the underlying data:
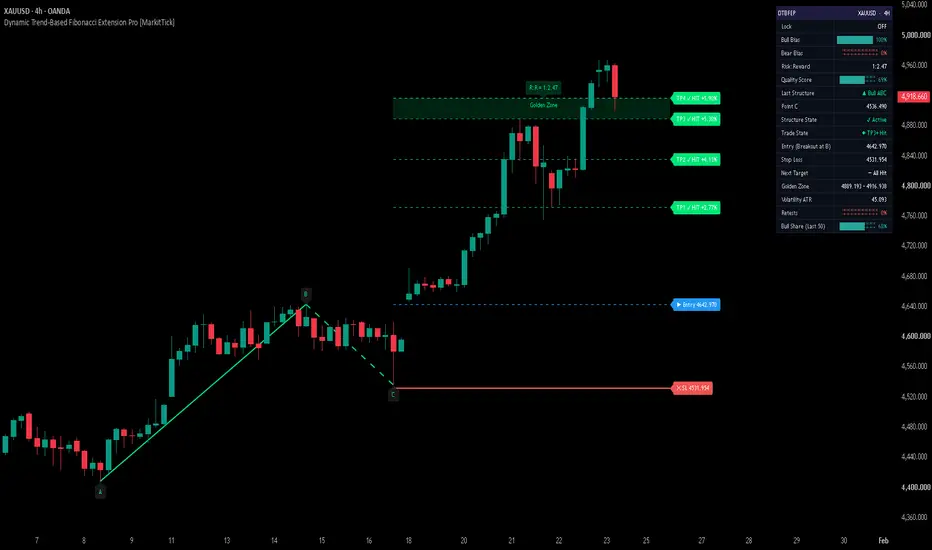
● Primary Structure Lines
- Solid Trendlines: Represent the A-B impulse move.
- Dashed Trendlines: Represent the B-C retracement move.
- Color Coding: Bullish structures appear in Emerald Green (#00E676), while Bearish structures appear in Sunset Red (#FF5252).
● Fibonacci Extension Levels
- 1.000 Level (Equality): Displayed as a dotted line, signifying where Wave C equals Wave A.
- 1.272 Level: Often used as a harmonic reversal or "bull trap" zone.
- 1.500 & 1.618 (Golden Zone): The area between these two levels is highlighted with a semi-transparent fill. This "Golden Zone" is the primary target for Wave 3 or Wave C extensions.
- Elliott Wave Labels: Extension levels are automatically tagged with context, such as "Wave 3" or "Harmonic," to assist in wave counting.
● Retest and Invalidation Visuals
- Grayed Out: When price closes beyond Point C, the entire structure turns gray (#555555), indicating it is currently inactive.
- Orange Retest: If price returns to Point C under normal conditions, the structure turns Orange (#FF9800).
- Cyan Ideal Retest: If a retest occurs with low volume and a rejection candle (Pin Bar), the structure turns Cyan (#00BCD4), marking a high-probability entry.
● Risk/Reward Zones
- Entry Line: A Blue dashed line at the level of Point B.
- Stop Loss Zone: A Red transparent box extending from Point C to the SL buffer.
- Take Profit Zone: A Green transparent box extending to the 1.618 extension level.
● Higher Timeframe (HTF) Elements
HTF structures are drawn with thicker lines (width 3) and use distinct colors (Cyan for Bullish, Orange for Bearish) to ensure they are not confused with local timeframe data. Labels are prefixed with "HTF" for immediate identification.
🔍 Deconstruction of the Underlying Scientific and Academic Framework
The indicator is built upon several pillars of quantitative finance and technical theory:
• Phidias and the Golden Ratio
The mathematical foundation is rooted in the Fibonacci sequence and the limit of its ratios, approximately 1.618. In financial markets, this ratio is used to model the "growth" of a price impulse, based on the observation that market cycles often expand in proportions found in nature.
• Volatility-Adjusted Thresholds (Statistical Deviation)
By using the Average True Range (ATR), the script applies the principles of statistical volatility. Instead of a linear threshold, it uses a non-linear filter that accounts for the standard "noise" of the asset. This is academically linked to the concept of the "Signal-to-Noise Ratio" in time-series analysis.
• Volume-Price Agreement (VSA)
The retest logic incorporates elements of Volume Spread Analysis. The requirement for low volume during a retest of Point C is based on the theory that if an impulse is to continue, the counter-trend move should exhibit a lack of supply (in bullish cases) or a lack of demand (in bearish cases).
• Logarithmic Growth Models
The inclusion of logarithmic extension calculations recognizes that price action in high-growth assets is often exponential rather than linear. By applying natural logarithms, the script treats price moves as percentage changes, which is the standard for long-term econometric modeling.
📖 How to Use
- Setup Detection: Allow the script to identify an A-B-C structure. Wait for the "A-B-C" labels to appear on your chart.
- Validation: Check the dashboard in the corner. Ensure the "Scale Mode" and "Detection" methods match your trading style.
- Entry Strategy:
• Aggressive: Enter on the confirmation of Point C if the Volume and RSI filters pass.
• Conservative: Enter on a breakout of Point B (the Blue Entry Line).
• Retest: Wait for an "Ideal Retest" label (Cyan). This occurs when price touches Point C and forms a rejection candle on low volume. - Targeting: Use the 1.000 level for initial scaling and the 1.618 "Golden Zone" for final profit-taking.
- Risk Management: Place your physical stop-loss at the Red SL line. If the structure grays out, the trade thesis is invalidated.
⚙️ Inputs and Settings
● ● ZigZag Detection
• Pivot Lookback Depth: Controls how many bars are required to confirm a high or low. Higher values find "major" trends; lower values find "scalping" setups.
• Use ATR-Based Threshold: Toggles between volatility-adjusted or fixed percentage swing detection.
● ● Retest Precision Filters
• Min Bars After Break: Prevents "instant" retests that are often just price volatility. Requires a gap between the break of C and the return to C.
• Low Volume on Retest: When enabled, the retest must occur on volume lower than the 20-bar average.
• Rejection Candle at C: Requires a Pin Bar or Engulfing candle to trigger an "Ideal Retest" status.
● ● Momentum & Trend Filters
• Enable RSI Filter: Filters for setups where Point C is at a momentum extreme.
• Enable Trend Baseline Filter: Uses a 200 EMA to ensure you are only trading in the direction of the long-term trend.
● ● Higher Timeframe
• Select Timeframe: Choose which HTF to pull data from (e.g., Daily for an Hourly chart). This displays the "Big Picture" extensions.
🔓 vs 🔒 Dynamic Trend-Based Fibonacci Extension (Pro vs. Free)
• Object-Oriented Optimization
Object-Oriented Optimization: The Pro version shifts from standard functional programming to advanced Object-Oriented Methods attached to User-Defined Types (UDTs). It also utilizes var-declared, pre-computed global arrays for Fibonacci ratios to drastically reduce per-bar memory allocation and processing overhead.
• Algorithmic Trade Validation
Algorithmic Trade Validation: Introduces institutional-grade confirmation layers, including a Trend Baseline Filter (EMA), RSI Momentum validation, and a Volume Spike identifier, ensuring structures are mathematically validated before generating signals.
• Precision Retest & Retracement Engine
Precision Retest & Retracement Engine: Upgrades basic structural invalidation with strict B-C retracement depth constraints (e.g., 0.382–0.886). It includes a dynamic Retest Engine that classifies pullbacks as "Ideal" or "Normal" using real-time volume analysis and wick-to-range candlestick rejection logic.
• Zero-Repaint MTF Integration
Zero-Repaint MTF Integration: Implements a Higher Timeframe (HTF) algorithmic overlay using strictly compliant request.security calls, anchored with [1] offsets and barmerge.lookahead_on to absolutely prevent repainting.
• Advanced Analytics UI
Advanced Analytics UI: Features a dynamic on-chart Dashboard Table for real-time statistical tracking, an algorithmic Anti-Overlap label engine to prevent visual clutter, and visual Risk/Reward (R:R) mapping for Entry, Stop Loss, and Take Profit zones.
• Institutional JSON Webhooks
Institutional JSON Webhooks: Alert payloads are engineered as strictly formatted JSON strings designed for automated execution (e.g., PineConnector, 3Commas), dynamically calculating and appending the precise Entry Price, Target Price (TP), and a buffered Invalidation Price (SL).
• Fibonacci Time Extensions
Fibonacci Time Extensions: Projects vertical time-based targets (e.g., 1.0, 1.618) derived from the A-B impulse duration to forecast temporal reversal zones alongside price targets.
⚠️ Disclaimer
All provided scripts and indicators are strictly for educational exploration and must not be interpreted as financial advice or a recommendation to execute trades. I expressly disclaim all liability for any financial losses or damages that may result, directly or indirectly, from the reliance on or application of these tools. Market participation carries inherent risk where past performance never guarantees future returns, leaving all investment decisions and due diligence solely at your own discretion.
Informacje o Wersji
Optimizing indicator performance and execution speedInformacje o Wersji
The updated version enhances the dashboard with a comprehensive layout featuring visual progress bars for trend bias and detailed metrics, alongside configurable alert actions for long and short positions. It optimizes internal structure management by fully leveraging object-oriented methods for cleaner code execution and improved efficiency. Additionally, the alert system now incorporates dynamic JSON payloads for precise integration with external trading tools, ensuring better data accuracy. These changes collectively improve the user interface readability, operational reliability, and external automation capabilities of the indicator.Informacje o Wersji
This release advances Dynamic Trend-Based Fibonacci Extension Pro from a structure-plotting tool into a complete, decision-grade trade framework. Structure validation is now context-aware: every setup is evaluated against the exact market conditions present at its formation pivot rather than at confirmation, and it must clear an expanded confluence layer covering trend baseline, momentum, momentum divergence, participation, volatility regime, higher-timeframe bias alignment, structural duration, and a minimum risk-to-reward gate — all consolidated into a single weighted 0–100 Quality Score with a user-defined acceptance threshold. Trade mechanics were rebuilt around selectable entry models and adaptive stop placement, with a full lifecycle engine that tracks each setup from pending through fill, staged target completion, invalidation, time-based expiry, and stop-out, each state emitting its own structured webhook alert including close-position and target-hit events. Visual and analytical output was extended with multi-structure confluence zones that highlight where extension targets from several setups (including higher-timeframe) converge, intelligent label de-collision, and a substantially expanded live dashboard exposing trade state, active levels, next target, regime, and alignment status. The engine was also hardened throughout for higher precision and lower computational load — refined swing detection with instrument-aware tolerance, corrected higher-timeframe time-axis mapping, consolidated data requests, and a single authoritative source for all trade-level calculations.Informacje o Wersji
Chart update onlyInformacje o Wersji
Nothing has been changed in the code; only a detailed description of the new features has been added.Version Update Summary
New Feature: Trade Quality Score
- A new confluence engine scores every A-B-C structure from 0-100 the moment it forms, blending trend alignment, momentum, volume, higher-timeframe agreement, market regime, and risk-to-reward into one weighted number.
- Replaces simple pass/fail filtering with a graded read on setup strength.
- Structures scoring below a chosen minimum can optionally be filtered out entirely.
- Adds a "Quality Score" row to the dashboard, shown as a 0-100 progress bar.
How to Use: Trade Quality Score
- The Quality Score bar fills further as more confluence factors align in favor of the active structure.
- A higher score means trend, momentum, volume, HTF bias, market conditions, and reward-to-risk are more broadly in agreement — generally a stronger technical case.
- A low score means the setup is only supported by one or two factors and relies more on price geometry alone.
- This is a relative confluence gauge, not a guarantee of outcome — best used alongside the existing filters and price action context.
New Feature: Trade Lifecycle Tracking
- Each structure now progresses through a visible lifecycle: Pending, Entered, TP1 Hit, TP2 Hit, TP3+ Hit, and Stopped.
- Gives a running status of where the most recent setup stands in real time, not just static Fibonacci levels.
- Adds a "Trade State" row with color coding, plus new "Entry," "Stop Loss," and "Next Target" rows to the dashboard.
How to Use: Trade Lifecycle Tracking
- "Pending" means price hasn't reached the entry level yet; "Entered" means the trade is live.
- "TP1/TP2/TP3+ Hit" show progressively deeper targets reached, so you can see how far the move has extended.
- "Stopped" means the protective stop was hit and the idea is closed.
- Coloring moves from neutral (Pending) to an entered color, to bullish as targets are hit, to bearish if stopped — an at-a-glance read of trade progress.
- The Next Target row always shows the nearest remaining objective.
New Feature: Fibonacci Cluster Zones
- Scans across active structures, including HTF structures when enabled, and highlights price bands where multiple extension levels stack closely together.
- Surfaces areas where several independent Fibonacci projections agree on roughly the same price — typically stronger reaction zones than any single level alone.
- Adds shaded boxes on the chart marking these zones, extending to the right.
How to Use: Fibonacci Cluster Zones
- A shaded cluster box marks a price band where multiple extension levels from different structures land close together.
- More stacked levels in a zone means more technical agreement at that price band, often treated as a higher-probability reaction area.
- These zones supplement the individual Fibonacci levels already on the chart rather than replacing them.
New Feature: Additional Structure Validation Filters
- Five new optional filters for finer control over which A-B-C structures are allowed to form: HTF Bias Alignment, RSI Momentum Divergence, Minimum Structure Duration, Minimum Risk:Reward Gate, and Market Regime Gate (choppy vs. trending conditions).
- Adds a "Regime" row and an "HTF Align" row to the dashboard reflecting these conditions in real time.
How to Use: Additional Structure Validation Filters
- The Regime row reflects current market conditions — trending readings show bullish coloring, choppier readings show bearish coloring.
- The HTF Align row shows whether the latest structure agrees with the higher-timeframe bias: "Aligned" trades with the larger trend, "Against" flags a counter-trend structure.
- These filters layer on top of the existing Trend, RSI, Volume, and Retracement filters, so any combination can be used.
New Feature: Flexible Entry Modes
- Entry price is no longer fixed to Point B. Choose between a breakout entry at B, a limit entry inside the B-C retracement zone, or a limit entry at Point C.
- Lets entry logic match different trading styles, from breakout to pullback entries.
How to Use: Flexible Entry Modes
- "Breakout at B" is a stop-style entry for traders wanting confirmation before entering.
- "Retrace Zone" is a limit-style entry partway back toward C for a better price on a pullback.
- "Retest at C" enters at the structural origin of the move.
New Feature: ATR-Based Stop Loss Mode
- Stop loss can now be a fixed percentage beyond Point C (as before) or a multiple of market volatility, so stops adapt automatically across instruments with different price ranges.
How to Use: ATR-Based Stop Loss Mode
- Percent mode keeps a fixed percentage distance from Point C.
- ATR mode scales the stop distance with volatility — wider on volatile instruments or timeframes, tighter on calmer ones.
New Feature: Time Stop Invalidation
- Structures whose entry never triggers within a set multiple of the original swing duration are now automatically invalidated, preventing stale setups from sitting on the chart indefinitely.
How to Use: Time Stop Invalidation
- A structure aging out is treated like an invalidated one — grayed out or removed depending on your display setting — and the Trade State shows it as Stopped.
- Helps quickly distinguish setups that are still actionable from ones that simply went stale.
Refinements
- Pivot detection now supports a tolerance for near-equal highs/lows, reducing missed swings on tick-quantized instruments.
- Engulfing candle detection now correctly checks the prior candle's color, improving Ideal Retest accuracy.
- Trend, RSI, and Volume filters now evaluate conditions at the actual pivot point instead of several bars later, for more accurate validation.
- Take-profit labels now number strictly by price distance, so custom ratios land correctly in the target sequence.
- Regime Score now draws from a rolling history instead of only the on-screen structures, giving a steadier bullish/bearish bias reading.
- Stale drawings from revised swing points are now properly cleared before redrawing.
- Close Long/Close Short alert actions now fire correctly on invalidation or time-stop.
- Higher-timeframe data requests are consolidated for better chart efficiency.
- Dashboard reorganized to fit the new Quality Score, Trade State, Entry, Stop Loss, Next Target, Regime, and HTF Align rows.
Informacje o Wersji
Dynamic Trend-Based Fibonacci Extension Pro — Update SummaryA capability and accuracy release: live trade tracking on the chart, second-chance retests, a Signal Lock, full higher-timeframe alerting, and a deep correction pass on swing detection.
MAJOR NEW FEATURES
Signal Lock
- One toggle freezes the current setup while a trade is still working — no new structure can replace it on the chart.
- Releases itself automatically once the trade closes; no manual reset.
How to Use
- The dashboard Lock row reads OFF when idle, Armed when on but protecting nothing, and ACTIVE when holding a live setup.
- ACTIVE confirms the levels on screen belong to the trade you are already in.
Second-Chance Retests After a Stop
- A stopped or expired structure can now revive when price returns to Point C — previously it was finished for good.
- Visual Only redraws it while leaving the trade closed; New Trade resets it to pending, restores its levels and re-arms entry, target and stop alerts as a genuine second trade.
- The number of revivals one structure may earn is user-adjustable.
How to Use
- The Structure State row appends a revival counter — a counter means you are on a second or later attempt at the same level.
- Labels reverting from hit status back to live prices is your cue that a new attempt has begun.
- A high revival count warns that the level keeps being tested without resolving.
Live Trade Status on Chart Labels
- Entry, stop and target labels now update in place as price interacts with them, instead of showing static prices.
- Each target reached is marked hit and reports the move achieved from entry as a percentage.
- A setup that ran out of time is now visually distinct from one genuinely stopped out.
How to Use
- An entry label switching to hit status confirms the setup is live; until then the trade is pending.
- Hit target labels show the percentage gained from entry — a running read on how much of the projection is captured.
- On the dashboard, Expired means the setup never triggered in its window and is shown neutrally, not as a loss.
Full Higher-Timeframe Alert Coverage
- Higher-timeframe structures now fire new-structure and Point C retest alerts, on equal footing with chart-timeframe structures.
- Payloads now report the exact structure that triggered them, ending mismatched levels in notifications.
MINOR FEATURES
- Multi-event alert payloads — every event on a shared bar is delivered in one notification, tagged with revival sequence and the full span of targets cleared.
- Chart compatibility guards — the script stops with a clear explanation on synthetic chart types and on an invalid higher-timeframe selection, preventing silently wrong levels.
- Persistent forward projection — level lines and labels stay projected ahead of price for the life of every structure; higher-timeframe labels sit further right so columns never collide.
- Dashboard context header — the header now shows the active symbol and timeframe, making screenshots and multi-chart layouts self-identifying.
ACCURACY AND RELIABILITY
- Swing detection rebuilt: a pivot confirms only once both surrounding windows are fully closed, removing swings accepted on incomplete information.
- A warm-up guard prevents structures forming before enough history exists.
- Higher-timeframe filter context is now sampled at the swing itself, so trend, momentum, volume, volatility and regime describe the moment the structure formed.
- Higher-timeframe swing placement on the time axis corrected; unresolvable swings are skipped rather than misplaced.
- Structures store their own pivot snapshot — a swing that later extends can no longer alter a structure already drawn and alerted.
- Unchanged structures are no longer redrawn or re-announced on later bars.
- Instruments without volume data no longer have every setup rejected by the volume filter.
- The stop is always placed a meaningful distance beyond Point C, with a fallback when volatility data is unavailable.
- A custom ratio matching a built-in level no longer duplicates a line, and custom levels take visual priority as intended.
- Entry and stop alerts confirm on bar close for repaint-free delivery; target alerts still fire on first touch.
- All forward projections are capped within platform drawing limits, preventing errors on long charts.
REFINEMENTS
- Dashboard restyled: alternating row shading, defined outer frame, refreshed header colouring, improved padding.
- Rows depending on an existing structure show a neutral placeholder instead of a misleading value when none exists.
- Extension levels use a consistent line style with price-first target labels and alternating markers; the stop line is thicker for instant separation.
- Golden Zone and Risk:Reward labels centred precisely on their spans.
- Label anti-overlap controls retired — separation is now automatic, removing three settings from the panel.
- Two unused colour settings removed.
- Cluster zones and dashboard compute only on the current bar, lightening load on long histories and multi-chart layouts.
Informacje o Wersji
Dynamic Trend-Based Fibonacci Extension Pro — Update SummaryMajor Improvements
- Take-profits that follow your entry — Only extension levels that sit beyond the entry are now numbered as take-profits. Levels on the wrong side of the entry keep a plain ratio label, so TP1, TP2 and TP3 always point in the trade's direction and are counted correctly.
- Stop loss confirmed on close — A stop is now registered when a bar closes beyond the stop level, not when a wick touches it, reducing stop-outs caused by brief spikes.
- Faster, confirmed invalidation — Invalidation and retests are now confirmed on the close of the bar that breaks or reclaims Point C, one bar sooner than before, and a retest now requires price to actually cross back through Point C.
- Complete trade lifecycle — An invalidated structure now closes its open trade, a structure dropped by the Keep Last N Structures limit closes its open trade at that bar's close, and opposite-direction entries can no longer trigger on the same bar.
- Smarter alert actions — Take-profit alerts now send a partial-close action for every target except the last and a full close action at the final target, and their payload carries the current stop. Close alerts state whether the trade was invalidated or replaced, and fire only when a trade was actually open.
- HTF never stops the script — Picking a higher timeframe that is lower than the chart no longer raises an error; the chart timeframe is used instead and the dashboard flags the HTF as skipped.
New Features
- Pine Screener columns — Direction, Bars Since Signal, Entry, Stop, TP1, TP2, TP3, Targets Hit and Trade Active, added from the screener's Manage columns menu. They show the trade's levels as it opened, the same ones its alerts send. The Pine Screener is available on TradingView Premium and Ultimate plans only and calculates on the most recent 500 bars.
- Expanded dashboard — New rows for Point C, the Golden Zone price range, a Time Stop countdown, and the higher-timeframe trade: HTF Trade State, HTF Entry, HTF Stop, HTF Next Target and HTF Bias.
- Live filter readout — Every enabled filter now has its own row showing its reading at Point C of the last structure: Trend Filter (EMA), RSI Filter, Volume Filter, Retracement, RSI Divergence, Leg Bars, Min R:R Gate and Regime.
- Skipped-setting warnings — A highlighted row now tells you when an enabled setting cannot apply: volume checks on a symbol with no volume, the HTF Bias Filter while HTF is off, Time Stop while invalidation is off, and an HTF lower than the chart.
- Closed-trade marking — Once a trade closes, its Entry, Stop Loss and take-profit lines stop a short distance past the closing bar instead of following price, and the stop label shows the result at exit.
- Helpful tooltips — Hovering the Last Structure row shows how much history the current settings need before a structure can form; the Volume Filter row notes tick-volume feeds; the Bull Share (Last 50) row explains what it counts.
Refinements
- Retired alerts — The New Bullish/Bearish A-B-C Structure alerts and the Point C Retest alerts have been removed along with their action settings. Trade events now arrive through Entry Filled, Take Profit Hit, Stop Loss Hit and the Close Long/Short signals; recreate any alert built on the retired ones.
- Take-profit alert timing — Targets reached on the entry bar alert at that bar's close; later targets alert as soon as they are reached.
- Precision retest filters — The volume and rejection-candle checks now judge the retest bar itself, and the low-volume check is skipped on symbols that report no volume.
- Retest After Stop — Now also applies to trades closed by invalidation.
- Quality Score — A component with no reading at Point C is now left out instead of counted as neutral, and a structure whose score cannot be formed does not pass.
- Data integrity — Log Scale no longer builds a structure with a point at or below zero; ATR stop mode no longer arms a structure before its volatility reading exists; volume averages ignore bars without volume; HTF Bias Alignment is skipped while HTF is off instead of rejecting every structure.
- Time extensions — Projections too far ahead are no longer drawn at the wrong bar, and time labels are easier to read.
- Cleaner chart — The separate target line was removed, since take-profits are the extension lines beyond the entry; the entry label keeps its price after a fill; Entry and SL labels use solid backgrounds; cluster zones ignore invalid levels.
- Dashboard — Risk:Reward shows as a ratio, Retests as a share bar, Regime Score is now Bull Share (Last 50), filter rows appear only when their filter is on, Lock shows ACTIVE or OFF, Trade State adds Invalidated, timeframes display in compact form, and Dashboard Size was removed.
- Settings panel — Keep Last N Structures moved to Core; Enable R:R Visualizer, Extend Right and the time-extension settings moved to Visuals; tooltips added across the panel; dashboard colours reworked with new Dashboard Text and Dashboard Warning options.
Performance
- Lighter higher-timeframe data request and fewer temporary objects per bar, for quicker loading on long histories.
How to Use
- Take-profit hit labels — A hit target shows its number and the gain from entry in percent.
- Stop hit label — Shows the result of the trade at the closing price that confirmed the stop.
- Plain ratio labels — An extension level showing only its ratio is not a target for the current entry.
- Filter rows — Green means the last structure passes that filter at Point C; red means it fails.
- Highlighted rows — The setting is enabled but skipped on this chart; the row states why.
- Time Stop row — Bars left before a pending structure expires if its entry never fills.
- Golden Zone row — The price range of the last structure's golden zone.
- Trade State: Invalidated — The trade was closed because its structure broke Point C.
- Bull Share (Last 50) — Share of recent chart-timeframe structures that were bullish.
Settings Reset Notice
This update changes the settings panel, so your saved settings for this indicator will return to their defaults; please re-enter them after updating.
Affected: Keep Last N Structures, and every setting in the Filters, Quality Score, Invalidation, HTF, Fib Levels, Confluence, Trade Tools, Visuals, Dashboard, Alerts and Colors sections.
Informacje o Wersji
Dynamic Trend-Based Fibonacci Extension Pro — Update SummaryMajor Improvements
- Confirmed Swing Points — swing points are now locked in only on closed bars, so the A-B-C structures, levels and signals you see on the live bar no longer shift while the candle is still forming.
- Order-Safety Checks — every new setup is now checked for sensible Entry, Stop Loss and target placement before it is traded. A setup that fails keeps only its A-B-C drawing, sends no entry alert, and never pushes out a structure you are already tracking.
- Gap-Aware Entries — when a bar opens beyond the entry level, so the level was never actually traded, the entry is now taken at that bar's close and the targets and R:R are measured again from it. If the new entry no longer makes a valid trade, the setup is cancelled instead of filling at a price that never existed.
- Pending Setups Cancel on a Stop Break — a setup still waiting for its fill is now cancelled when a bar closes beyond its stop, so it can no longer fill after its idea has already failed.
- Redesigned HTF Bias — the higher-timeframe bias is now a clear Bull or Bear direction read from higher-timeframe market structure, and HTF Bias Alignment and the HTF Align row now judge each setup against the bias at its own Point C.
New Features
- Cancelled Trade State — setups cancelled before their fill are now shown as their own state on the dashboard, separate from stopped or invalidated trades.
- No Trade State — when the newest setup on the chart or the higher timeframe failed the safety checks, its trade state row says so plainly.
- Skipped-Setting Warnings — the dashboard now flags Retest Detection when it cannot work with your current invalidation settings, and skipped-setting warnings stay visible even with the full dashboard hidden.
- Standard Chart Notice — on Heikin Ashi, Renko and other synthetic chart types, a clear on-chart notice now asks you to switch to Candles, instead of the script stopping with an error.
- Expanded Colour Controls — new colour settings for take-profit and R:R label backgrounds, Golden Zone fills, time labels, Retest and Ideal Retest highlights, and grayed-out structures, each with separate chart and HTF options.
- HTF Trade in Data Window — the direction of the open higher-timeframe trade is now shown in the Data Window.
Refinements
- Stop Loss Alerts Unified — a stop-loss exit now sends the same Close Long or Close Short action word as other closes, with a payload in the same shape as the other exit alerts, so one webhook handler covers every exit. The alert condition is now titled SL Hit.
- One Alert per Target — when several trades reach different targets on the same bar, each target level now sends its own alert instead of being merged into one.
- Safer Webhook Text — symbols, timeframes and action words containing special characters no longer break the alert message format.
- Cleaner Fibonacci Levels — only levels beyond the entry are drawn, the Golden Zone appears only when both of its levels are live targets, and levels are re-labelled correctly after a gap fill.
- Custom Ratio Duplicates — a Custom Ratio matching an enabled built-in level no longer draws a second copy of that level.
- Lock Signal — now freezes new signals whenever it is on, whether or not a trade is open.
- Quality Score Display — the score now reads out of 100, its row is hidden while the score is off, and a tooltip notes when the feed reports tick volume.
- Clearer Tooltips — settings now explain how they interact, including which options depend on Structure Invalidation and when a score component is left out.
- Number Formatting — R:R, RSI and regime readings now always show a leading digit, and percentage labels stay readable in edge cases.
Performance
- Filters and the Quality Score now skip their calculations when switched off, and higher-timeframe data requests were trimmed for a lighter, faster load.
- Improved stability on large pivot depth settings and long chart histories.
How to Use
- Cancelled — the setup was called off before entry, either because price closed beyond its stop or because a gapped fill no longer made a valid trade. No position was opened.
- No Trade — the newest structure failed the safety checks; its A-B-C drawing remains for reference only.
- HTF Bias Bull / Bear — the current higher-timeframe direction; a dash means no higher-timeframe structure has formed yet.
- Skipped warning rows — a highlighted row means a setting you enabled is not taking effect with your current configuration.
Settings Reset Notice
Your saved settings for this indicator will return to their defaults after updating, so please re-enter your preferred values.

💡 Proprietary indicators. Original research. Built by analysts who trade.
📢 Free Telegram: t.me/MarkitTick_Updates
👑 Premium: TradingView Marketplace
📘 Guides: markittick.com
📢 Free Telegram: t.me/MarkitTick_Updates
👑 Premium: TradingView Marketplace
📘 Guides: markittick.com
Wyłączenie odpowiedzialności
Informacje i publikacje nie stanowią i nie powinny być traktowane jako porady finansowe, inwestycyjne, tradingowe ani jakiekolwiek inne rekomendacje dostarczane lub zatwierdzone przez TradingView. Więcej informacji znajduje się w Warunkach użytkowania.
💡 Proprietary indicators. Original research. Built by analysts who trade.
📢 Free Telegram: t.me/MarkitTick_Updates
👑 Premium: TradingView Marketplace
📘 Guides: markittick.com
📢 Free Telegram: t.me/MarkitTick_Updates
👑 Premium: TradingView Marketplace
📘 Guides: markittick.com
Wyłączenie odpowiedzialności
Informacje i publikacje nie stanowią i nie powinny być traktowane jako porady finansowe, inwestycyjne, tradingowe ani jakiekolwiek inne rekomendacje dostarczane lub zatwierdzone przez TradingView. Więcej informacji znajduje się w Warunkach użytkowania.