OPEN-SOURCE SCRIPT
IBS Internal Bar Strength (Intraday)
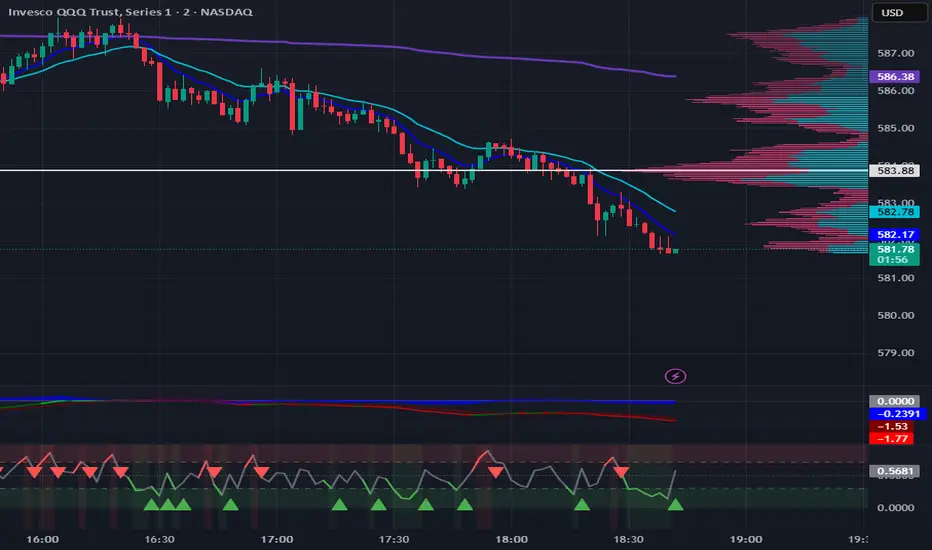
# IBS — Internal Bar Strength (Intraday)
### TradingView Publication Description
*by imhurtin | theTRADINGDECK*
---
## What Is IBS?
**Internal Bar Strength (IBS)** measures where price closed *within* the current bar's range.
**Formula:** `IBS = (Close - Low) / (High - Low)`
The result is a value between 0 and 1:
- **IBS = 0** → Price closed exactly at the low (maximum weakness)
- **IBS = 1** → Price closed exactly at the high (maximum strength)
- **IBS = 0.5** → Price closed at the midpoint (neutral)
---
## How To Read It
| IBS Value | Meaning | Bias |
|-----------|---------|------|
| Below 0.3 | Closed in bottom 30% of range | Potential bounce / long setup |
| 0.3 – 0.7 | Closed near midrange | Neutral — no edge |
| Above 0.7 | Closed in top 70% of range | Potential fade / short setup |
**Green bar / background** = IBS in oversold territory (below 0.3)
**Red bar / background** = IBS in overbought territory (above 0.7)
**Triangle up** = IBS crossing back above 0.3 (bounce signal)
**Triangle down** = IBS crossing back below 0.7 (fade signal)
---
## When To Use It
IBS works best as a **confirmation tool** — not a standalone signal. Here's when it adds real value:
### ✅ LONG SETUP (Bounce)
Use IBS < 0.3 to confirm a long when:
- Price has sold off and is at or near a key support level (VWAP, PDL, ORB low, EMA)
- Market internals are neutral or turning bullish (TTICK recovering, AADD > -200)
- Price action shows a hammer, pin bar, or inside bar at support
- IBS crosses back above 0.3 = signal that sellers are losing grip
**Entry:** IBS crosses above 0.3 + candle body closes back above support
**Stop:** Below the low of the signal candle
**Target:** VWAP or next resistance level
---
### ✅ SHORT SETUP (Fade)
Use IBS > 0.7 to confirm a short when:
- Price has pushed into resistance (PDH, VWAP from below, ORB high, EMA)
- Market internals are neutral or turning bearish (TTICK fading, AADD < +200)
- Price action shows a shooting star, bearish engulfing, or doji at resistance
- IBS crosses back below 0.7 = signal that buyers are exhausted
**Entry:** IBS crosses below 0.7 + candle body closes back below resistance
**Stop:** Above the high of the signal candle
**Target:** VWAP or next support level
---
## What It Does NOT Do
- ❌ IBS alone is NOT a buy or sell signal — always confirm with price action + internals
- ❌ Do not trade IBS signals against the trend — if the trend is strongly down, IBS < 0.3 bounces fail
- ❌ Do not use in the first 5–10 minutes of market open — too much noise, IBS whipsaws
- ❌ Do not use on low-volume tickers — IBS requires meaningful price action within the bar
---
## Best Timeframes
| Timeframe | Use Case |
|-----------|----------|
| **2-minute** | Precise entry timing after signal forms on 5m |
| **5-minute** | Primary signal timeframe — best balance of signal vs noise |
| **15-minute** | Swing trade confirmation or higher timeframe context |
| **Daily** | Original IBS application — mean reversion swing trades |
---
## Recommended Workflow (Intraday / 0DTE)
1. **Mark your levels** — VWAP, PDH, PDL, ORB High/Low before the trade
2. **Check market internals** — TTICK, AADD, VVOLD must support direction
3. **Watch for IBS extreme** — below 0.3 at support OR above 0.7 at resistance
4. **Wait for the cross** — IBS must cross BACK through the threshold (not just touch it)
5. **Confirm with price action** — candle body closing beyond the level seals it
6. **Enter with defined stop** — stop beyond the signal candle, minimum 1:1.5 R:R
---
## Settings
| Setting | Default | Description |
|---------|---------|-------------|
| IBS Length | 1 | Number of bars for IBS calculation (1 = current bar) |
| Smoothing (EMA) | 3 | Light smoothing to reduce noise — increase for smoother line |
| Overbought Level | 0.7 | IBS fade/short threshold |
| Oversold Level | 0.3 | IBS bounce/long threshold |
| Show Entry Signals | On | Show triangle markers on threshold crosses |
| Color Background | On | Highlight bars in extreme zones |
---
## Alerts
Two built-in alerts:
- **IBS Bounce Setup** — fires when IBS crosses above the oversold level
- **IBS Fade Setup** — fires when IBS crosses below the overbought level
Set alerts on your preferred ticker and timeframe. Recommended: SPY or QQQ on the 5-minute chart.
---
## Important Notes
This indicator is a **tool, not a strategy**. The edge comes from combining IBS with:
- Strong key levels (support/resistance)
- Market internals confirmation
- Clean price action setup
- Proper risk management
**No indicator replaces discipline.** Always define your stop before entry. If the setup doesn't meet all criteria — no trade is a good trade.
---
*Built for intraday traders. Stack the deck in your favor.*
*— theTRADINGDECK*
### TradingView Publication Description
*by imhurtin | theTRADINGDECK*
---
## What Is IBS?
**Internal Bar Strength (IBS)** measures where price closed *within* the current bar's range.
**Formula:** `IBS = (Close - Low) / (High - Low)`
The result is a value between 0 and 1:
- **IBS = 0** → Price closed exactly at the low (maximum weakness)
- **IBS = 1** → Price closed exactly at the high (maximum strength)
- **IBS = 0.5** → Price closed at the midpoint (neutral)
---
## How To Read It
| IBS Value | Meaning | Bias |
|-----------|---------|------|
| Below 0.3 | Closed in bottom 30% of range | Potential bounce / long setup |
| 0.3 – 0.7 | Closed near midrange | Neutral — no edge |
| Above 0.7 | Closed in top 70% of range | Potential fade / short setup |
**Green bar / background** = IBS in oversold territory (below 0.3)
**Red bar / background** = IBS in overbought territory (above 0.7)
**Triangle up** = IBS crossing back above 0.3 (bounce signal)
**Triangle down** = IBS crossing back below 0.7 (fade signal)
---
## When To Use It
IBS works best as a **confirmation tool** — not a standalone signal. Here's when it adds real value:
### ✅ LONG SETUP (Bounce)
Use IBS < 0.3 to confirm a long when:
- Price has sold off and is at or near a key support level (VWAP, PDL, ORB low, EMA)
- Market internals are neutral or turning bullish (TTICK recovering, AADD > -200)
- Price action shows a hammer, pin bar, or inside bar at support
- IBS crosses back above 0.3 = signal that sellers are losing grip
**Entry:** IBS crosses above 0.3 + candle body closes back above support
**Stop:** Below the low of the signal candle
**Target:** VWAP or next resistance level
---
### ✅ SHORT SETUP (Fade)
Use IBS > 0.7 to confirm a short when:
- Price has pushed into resistance (PDH, VWAP from below, ORB high, EMA)
- Market internals are neutral or turning bearish (TTICK fading, AADD < +200)
- Price action shows a shooting star, bearish engulfing, or doji at resistance
- IBS crosses back below 0.7 = signal that buyers are exhausted
**Entry:** IBS crosses below 0.7 + candle body closes back below resistance
**Stop:** Above the high of the signal candle
**Target:** VWAP or next support level
---
## What It Does NOT Do
- ❌ IBS alone is NOT a buy or sell signal — always confirm with price action + internals
- ❌ Do not trade IBS signals against the trend — if the trend is strongly down, IBS < 0.3 bounces fail
- ❌ Do not use in the first 5–10 minutes of market open — too much noise, IBS whipsaws
- ❌ Do not use on low-volume tickers — IBS requires meaningful price action within the bar
---
## Best Timeframes
| Timeframe | Use Case |
|-----------|----------|
| **2-minute** | Precise entry timing after signal forms on 5m |
| **5-minute** | Primary signal timeframe — best balance of signal vs noise |
| **15-minute** | Swing trade confirmation or higher timeframe context |
| **Daily** | Original IBS application — mean reversion swing trades |
---
## Recommended Workflow (Intraday / 0DTE)
1. **Mark your levels** — VWAP, PDH, PDL, ORB High/Low before the trade
2. **Check market internals** — TTICK, AADD, VVOLD must support direction
3. **Watch for IBS extreme** — below 0.3 at support OR above 0.7 at resistance
4. **Wait for the cross** — IBS must cross BACK through the threshold (not just touch it)
5. **Confirm with price action** — candle body closing beyond the level seals it
6. **Enter with defined stop** — stop beyond the signal candle, minimum 1:1.5 R:R
---
## Settings
| Setting | Default | Description |
|---------|---------|-------------|
| IBS Length | 1 | Number of bars for IBS calculation (1 = current bar) |
| Smoothing (EMA) | 3 | Light smoothing to reduce noise — increase for smoother line |
| Overbought Level | 0.7 | IBS fade/short threshold |
| Oversold Level | 0.3 | IBS bounce/long threshold |
| Show Entry Signals | On | Show triangle markers on threshold crosses |
| Color Background | On | Highlight bars in extreme zones |
---
## Alerts
Two built-in alerts:
- **IBS Bounce Setup** — fires when IBS crosses above the oversold level
- **IBS Fade Setup** — fires when IBS crosses below the overbought level
Set alerts on your preferred ticker and timeframe. Recommended: SPY or QQQ on the 5-minute chart.
---
## Important Notes
This indicator is a **tool, not a strategy**. The edge comes from combining IBS with:
- Strong key levels (support/resistance)
- Market internals confirmation
- Clean price action setup
- Proper risk management
**No indicator replaces discipline.** Always define your stop before entry. If the setup doesn't meet all criteria — no trade is a good trade.
---
*Built for intraday traders. Stack the deck in your favor.*
*— theTRADINGDECK*
Skrypt open-source
W zgodzie z duchem TradingView twórca tego skryptu udostępnił go jako open-source, aby użytkownicy mogli przejrzeć i zweryfikować jego działanie. Ukłony dla autora. Korzystanie jest bezpłatne, jednak ponowna publikacja kodu podlega naszym Zasadom serwisu.

Wyłączenie odpowiedzialności
Informacje i publikacje nie stanowią i nie powinny być traktowane jako porady finansowe, inwestycyjne, tradingowe ani jakiekolwiek inne rekomendacje dostarczane lub zatwierdzone przez TradingView. Więcej informacji znajduje się w Warunkach użytkowania.
Skrypt open-source
W zgodzie z duchem TradingView twórca tego skryptu udostępnił go jako open-source, aby użytkownicy mogli przejrzeć i zweryfikować jego działanie. Ukłony dla autora. Korzystanie jest bezpłatne, jednak ponowna publikacja kodu podlega naszym Zasadom serwisu.
Wyłączenie odpowiedzialności
Informacje i publikacje nie stanowią i nie powinny być traktowane jako porady finansowe, inwestycyjne, tradingowe ani jakiekolwiek inne rekomendacje dostarczane lub zatwierdzone przez TradingView. Więcej informacji znajduje się w Warunkach użytkowania.