Period Excursion Map [Harmony Algo]
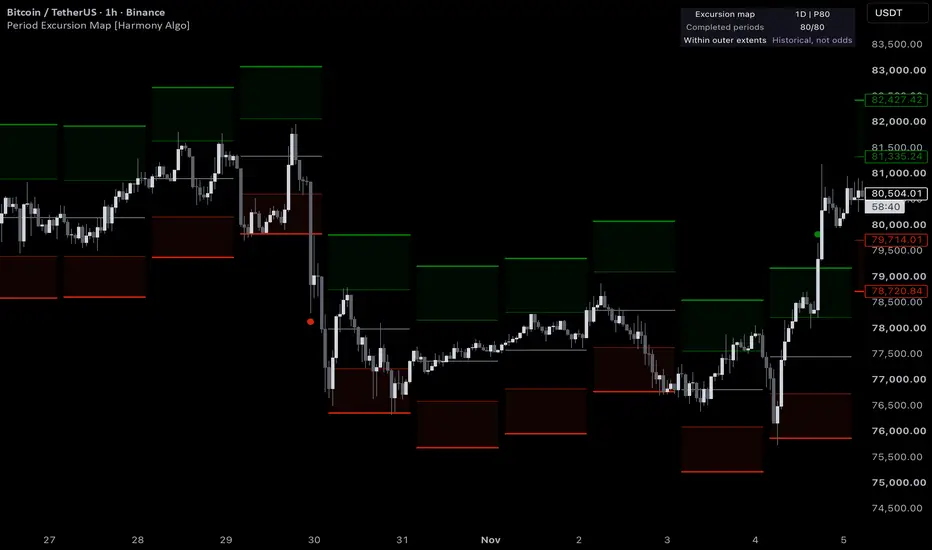
Period Excursion Map
How far has price traveled relative to the directional excursions of earlier completed periods? This indicator draws separate upper and lower historical excursion levels around the previous period's close. The map stays fixed throughout the current reference period: expanding price action does not move its own reference levels.
Read the map
A circle is an extension observation, not a buy, sell, reversal or continuation recommendation.
How the calculation works
For each fully completed reference period, the script measures its maximum high above the close preceding that period and its maximum low below the same starting close. Negative directional excursions are clipped to zero. Both distances are divided by the reference-period ATR already known before that historical period began.
Up to 80 completed periods are retained by default. Upper and lower samples are sorted independently and summarized with nearest-rank empirical percentiles. At rollover, those normalized distances are multiplied by the latest completed reference-period ATR and placed around the latest completed reference-period close. ATR length defaults to 20 reference periods. At least 20 valid completed samples are required before a map appears.
Why this approach is useful
It provides descriptive context for unusually extended movement. It does not estimate whether the final high or low is already in.
Setup and signal timing
Historical plot segments have a first-bar gap to separate maps. Five additional lines display the active period's full map from its beginning to its scheduled end; these are reference levels, not a projected price path. The panel's location text follows the current, possibly unfinished close and may change intrabar.
About the example chart
The BTCUSDT one-hour chart illustrates fixed daily levels, a downside exceedance and an upside exceedance alongside subsequent price movement. It is a selected historical illustration of the display, not a representative performance sample or a trading result.
Important limitations
This is a descriptive price-context tool. It has no position sizing, stop-loss or entry/exit system, and no demonstrated predictive or profitability edge. No strategy backtest is presented.
How far has price traveled relative to the directional excursions of earlier completed periods? This indicator draws separate upper and lower historical excursion levels around the previous period's close. The map stays fixed throughout the current reference period: expanding price action does not move its own reference levels.
Read the map
- White line: previous reference-period close.
- Green levels: median and selected outer percentile of historical upward excursions.
- Red levels: equivalent downward excursions. The default outer percentile is 80.
- Shaded zones: the space between each median and outer extent. Colors describe location, not trade direction.
- Small circles: the first confirmed chart-bar close beyond each side's outer extent during the period. Both sides can be exceeded in the same period; each side can alert once per period.
A circle is an extension observation, not a buy, sell, reversal or continuation recommendation.
How the calculation works
For each fully completed reference period, the script measures its maximum high above the close preceding that period and its maximum low below the same starting close. Negative directional excursions are clipped to zero. Both distances are divided by the reference-period ATR already known before that historical period began.
Up to 80 completed periods are retained by default. Upper and lower samples are sorted independently and summarized with nearest-rank empirical percentiles. At rollover, those normalized distances are multiplied by the latest completed reference-period ATR and placed around the latest completed reference-period close. ATR length defaults to 20 reference periods. At least 20 valid completed samples are required before a map appears.
Why this approach is useful
- A symmetric ATR channel gives the same distance to both sides; this map retains historical asymmetry between upward and downward paths.
- Yesterday's high and low provide one observation; this map summarizes a bounded history of completed periods.
- Unlike a rolling band, the current period cannot train or widen its own map.
It provides descriptive context for unusually extended movement. It does not estimate whether the final high or low is already in.
Setup and signal timing
- Use standard time-based candles on a chart timeframe strictly below the reference period.
- The default reference is one day; week and month are also available. On a daily chart, choose a weekly or monthly reference.
- Period boundaries follow the symbol's exchange calendar, not a custom local session.
- All higher-timeframe requests use offset, completed values. Levels become available on the first chart bar of the new period and remain fixed within it.
- Circles and alerts require a confirmed chart-bar close. Choose either first-close alert condition in TradingView's alert dialog.
Historical plot segments have a first-bar gap to separate maps. Five additional lines display the active period's full map from its beginning to its scheduled end; these are reference levels, not a projected price path. The panel's location text follows the current, possibly unfinished close and may change intrabar.
About the example chart
The BTCUSDT one-hour chart illustrates fixed daily levels, a downside exceedance and an upside exceedance alongside subsequent price movement. It is a selected historical illustration of the display, not a representative performance sample or a trading result.
Important limitations
- A historical percentile is not a future probability. An 80th percentile does not imply an 80% chance of containing the next period. The two one-sided percentiles are not a joint confidence interval.
- Regime changes, gaps and news can produce excursions far beyond either extent. ATR normalization does not remove these risks.
- Upward or downward samples can be zero, and levels can coincide.
- Available chart history affects the sample pool during warmup. Once the configured memory is filled, earlier unloaded samples are no longer part of the current pool.
- Data revisions, session settings and corporate-action adjustments can change historical values.
- Changing chart timeframe can change the first closing-bar exceedance event even when the frozen higher-timeframe levels agree.
- Chart timeframes equal to or above the reference period are rejected. Non-standard chart types are unsuitable for evaluating these events.
This is a descriptive price-context tool. It has no position sizing, stop-loss or entry/exit system, and no demonstrated predictive or profitability edge. No strategy backtest is presented.

Harmony Algo | harmonyalgo.com
Practical indicators for chart analysis. No performance guarantees.
Practical indicators for chart analysis. No performance guarantees.
Wyłączenie odpowiedzialności
Informacje i publikacje nie stanowią i nie powinny być traktowane jako porady finansowe, inwestycyjne, tradingowe ani jakiekolwiek inne rekomendacje dostarczane lub zatwierdzone przez TradingView. Więcej informacji znajduje się w Warunkach użytkowania.
Harmony Algo | harmonyalgo.com
Practical indicators for chart analysis. No performance guarantees.
Practical indicators for chart analysis. No performance guarantees.
Wyłączenie odpowiedzialności
Informacje i publikacje nie stanowią i nie powinny być traktowane jako porady finansowe, inwestycyjne, tradingowe ani jakiekolwiek inne rekomendacje dostarczane lub zatwierdzone przez TradingView. Więcej informacji znajduje się w Warunkach użytkowania.