OPEN-SOURCE SCRIPT
RSI Neural Engine
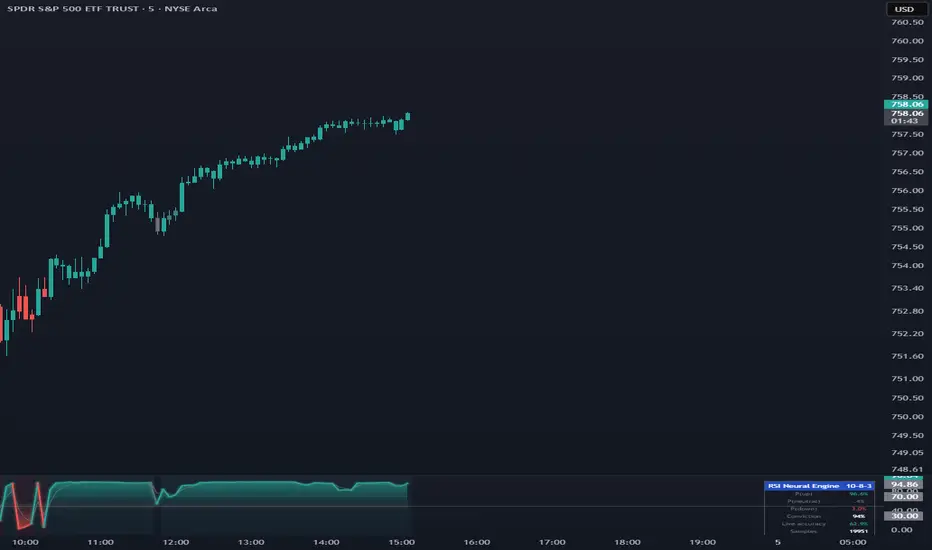
RSI Neural Engine — a real neural network that learns your chart, live
Most "AI" indicators are a glorified moving average with a buzzword bolted on. This isn't that.
The RSI Neural Engine is an actual neural network — forward pass, backpropagation, Adam optimizer, softmax output — training itself on your chart in real time. Open the source and you'll see the real thing: weight matrices, gradients, a live learning loop. No fake "AI," no hidden lookup table, no hardcoded rules wearing a lab coat.
It watches the market, makes a prediction, sees what price actually did, measures its own error, and rewires thousands of internal weights to do better next time. Every single bar. On your chart. In front of you.
Then it paints what it learned directly onto your candles. Green = the network is convinced up. Red = convinced down. Faded = it's unsure, so you stand aside. The stronger the conviction, the bolder the color. One glance tells you which side the model is on.
Why it's different
A plain RSI panics at every overbought reading and fades every rally. This network sees more. It's fed RSI in six dimensions — value, slope, acceleration, fast/slow spread, percentile, and volatility — plus real market context: a higher-timeframe RSI, trend strength, and where price sits in the trend. Its hidden layer learns the combinations. It can tell the difference between "overbought and topping" and "overbought because this is a monster trend — stay long." That's the leap a normal indicator can't make.
And it's honest
Built right into the panel: a live dashboard showing the network's up/neutral/down probabilities, its conviction, how much it's learned, which inputs it's actually leaning on, and its real, out-of-sample accuracy. It's a glass box. You watch it think — and you watch it prove itself.
How to use it
Add it to any chart. Any market, any timeframe.
Let it warm up. It starts from zero and learns from scratch — give it a few hundred bars. Candles stay uncolored until it's ready.
Set the Forecast Horizon to match how you trade. This is the one knob that matters most. Low = quick scalps. Higher = swings. Turn the dial until the colors match the moves you actually take. (Most people land around 10–14.)
Read the candles. Green = bullish regime. Red = bearish. Neutral = sit on your hands. Use it as a filter for your own entries and risk.
Glance at the dashboard. If Live Accuracy holds above the baseline, the network is finding real structure. If it doesn't, the model is telling you the truth — and that honesty is the whole point.
The settings that matter
Forecast Horizon — what the network aims at. Match it to your holding time. (start here)
Move Threshold (×ATR) — how big a move counts as real vs. noise. Higher = fewer, cleaner color changes.
Neutral Zone — how decisive the coloring is. Raise it to silence chop.
Higher Timeframe — the swing-context feed. Set it above your chart timeframe.
Hidden Units / Learning Rate / Epochs — full control of the network itself, if you like to tinker.
Reading the panel
Conviction line — the network's signed confidence; neutral-gray near the middle, saturating green or red as it commits.
Neutral-zone shading — the gray band mirrors exactly where candles stay uncolored.
Dashboard — live probabilities, conviction, sample count, input influence, and out-of-sample accuracy.
Just FYI: This is a serious, transparent machine-learning tool — not a crystal ball. RSI is built from price, so no model can conjure certainty the data doesn't hold. Judge it by the Live Accuracy readout, test it across several symbols and timeframes, and treat it as decision support, not a guarantee. This is not financial advice.
Most "AI" indicators are a glorified moving average with a buzzword bolted on. This isn't that.
The RSI Neural Engine is an actual neural network — forward pass, backpropagation, Adam optimizer, softmax output — training itself on your chart in real time. Open the source and you'll see the real thing: weight matrices, gradients, a live learning loop. No fake "AI," no hidden lookup table, no hardcoded rules wearing a lab coat.
It watches the market, makes a prediction, sees what price actually did, measures its own error, and rewires thousands of internal weights to do better next time. Every single bar. On your chart. In front of you.
Then it paints what it learned directly onto your candles. Green = the network is convinced up. Red = convinced down. Faded = it's unsure, so you stand aside. The stronger the conviction, the bolder the color. One glance tells you which side the model is on.
Why it's different
A plain RSI panics at every overbought reading and fades every rally. This network sees more. It's fed RSI in six dimensions — value, slope, acceleration, fast/slow spread, percentile, and volatility — plus real market context: a higher-timeframe RSI, trend strength, and where price sits in the trend. Its hidden layer learns the combinations. It can tell the difference between "overbought and topping" and "overbought because this is a monster trend — stay long." That's the leap a normal indicator can't make.
And it's honest
Built right into the panel: a live dashboard showing the network's up/neutral/down probabilities, its conviction, how much it's learned, which inputs it's actually leaning on, and its real, out-of-sample accuracy. It's a glass box. You watch it think — and you watch it prove itself.
How to use it
Add it to any chart. Any market, any timeframe.
Let it warm up. It starts from zero and learns from scratch — give it a few hundred bars. Candles stay uncolored until it's ready.
Set the Forecast Horizon to match how you trade. This is the one knob that matters most. Low = quick scalps. Higher = swings. Turn the dial until the colors match the moves you actually take. (Most people land around 10–14.)
Read the candles. Green = bullish regime. Red = bearish. Neutral = sit on your hands. Use it as a filter for your own entries and risk.
Glance at the dashboard. If Live Accuracy holds above the baseline, the network is finding real structure. If it doesn't, the model is telling you the truth — and that honesty is the whole point.
The settings that matter
Forecast Horizon — what the network aims at. Match it to your holding time. (start here)
Move Threshold (×ATR) — how big a move counts as real vs. noise. Higher = fewer, cleaner color changes.
Neutral Zone — how decisive the coloring is. Raise it to silence chop.
Higher Timeframe — the swing-context feed. Set it above your chart timeframe.
Hidden Units / Learning Rate / Epochs — full control of the network itself, if you like to tinker.
Reading the panel
Conviction line — the network's signed confidence; neutral-gray near the middle, saturating green or red as it commits.
Neutral-zone shading — the gray band mirrors exactly where candles stay uncolored.
Dashboard — live probabilities, conviction, sample count, input influence, and out-of-sample accuracy.
Just FYI: This is a serious, transparent machine-learning tool — not a crystal ball. RSI is built from price, so no model can conjure certainty the data doesn't hold. Judge it by the Live Accuracy readout, test it across several symbols and timeframes, and treat it as decision support, not a guarantee. This is not financial advice.
Skrypt open-source
W zgodzie z duchem TradingView twórca tego skryptu udostępnił go jako open-source, aby użytkownicy mogli przejrzeć i zweryfikować jego działanie. Ukłony dla autora. Korzystanie jest bezpłatne, jednak ponowna publikacja kodu podlega naszym Zasadom serwisu.

Wyłączenie odpowiedzialności
Informacje i publikacje nie stanowią i nie powinny być traktowane jako porady finansowe, inwestycyjne, tradingowe ani jakiekolwiek inne rekomendacje dostarczane lub zatwierdzone przez TradingView. Więcej informacji znajduje się w Warunkach użytkowania.
Skrypt open-source
W zgodzie z duchem TradingView twórca tego skryptu udostępnił go jako open-source, aby użytkownicy mogli przejrzeć i zweryfikować jego działanie. Ukłony dla autora. Korzystanie jest bezpłatne, jednak ponowna publikacja kodu podlega naszym Zasadom serwisu.
Wyłączenie odpowiedzialności
Informacje i publikacje nie stanowią i nie powinny być traktowane jako porady finansowe, inwestycyjne, tradingowe ani jakiekolwiek inne rekomendacje dostarczane lub zatwierdzone przez TradingView. Więcej informacji znajduje się w Warunkach użytkowania.