OPEN-SOURCE SCRIPT
Zaktualizowano Ultimate Indicator
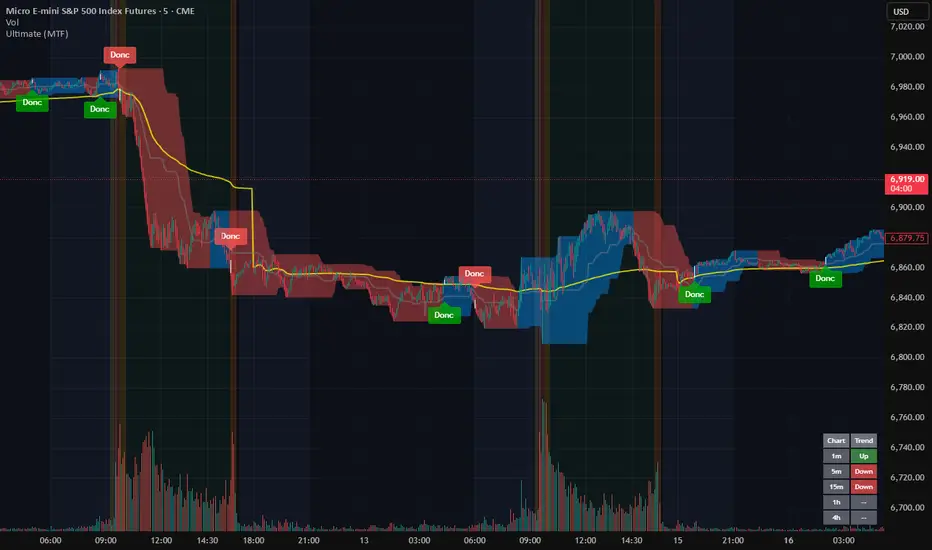
This is a combination of all the price chart indicators I frequently switch between. It contains my day time highlighter (for day trading), multi-timeframe long-term trend indicator for current commodity in the bottom right, customizable trend EMA which also has multi-timeframe drawing capabilities, VWAP, customizable indicators with separate settings from the trend indicator including: EMA, HL2 over time, Donchian Channels, Keltner Channels, Bollinger Bands, and Super Trend. The settings for these are right below the trend settings and can have their length and multiplier adjusted. All of those also have multi-timeframe capabilities separate from the trend multi-time settings.
The Day Trade Highlight option will draw faint yellow between 9:15-9:25, red between 9:25-9:45, yellow between 9:45-10:05. There will be one white background at 9:30am to show the opening of the market. while the market is open there will be a very faint blue background. For the end of the day there will be yellow between 15:45-15:50, red between 15:50-16:00, and yellow between 16:00-16:05. During the night hours, there is no coloring. The purpose of this highlight is to show the opening / closing times of the market and the hot times for large moves.
The indicators can also be colored in the following ways:
1. Simple = Makes all colors for the indicator Gray
2. Trend = Will use the Donchian Channels to get the short-trend direction and by default will color the short-term direction as Blue or Red. Unless using Super Trend, the Donchian Channel is used to find short-term trend direction.
3. Trend Adv = Will use the Donchian Channels to get the short-trend direction and by default will color the short-term direction as Blue or Red. Unless using Super Trend, the Donchian Channel is used to find short-term trend direction. If there is a short-term up-trend during a long-term down-trend, the Blue will become Navy. If short-term down-trend during long-term up-trend, the Red will be Brown.
4. Squeeze = Compares the Bollinger Bands width to the Keltner Channels width and will color based on relative squeeze of the market: Teal = no squeeze. Yellow = little squeeze. Red = decent squeeze. White = huge squeeze. if you do not understand this one, try drawing the Bollinger Bands while using the Squeeze color option and it should become more apparent how this works. I also recommend leaving the length and multiplier to the default 20 and 2 if using this setting and only changing the timeframe to get longer/shorter lengths as I've seen that changing the length or multiplier can more or less make it not work at all.
Along with the indicator settings are options to draw lines/labels/fills for the indicator. I enjoy having only fills for a cleaner look.
The Labels option will show Buy/Sell signals when the short-term trend flips to agree with the long-term trend.
The Trend Bars option will do the same as the Labels option but instead will color the bars white when a Buy/Sell option is given.
The Range Bars option shows will color a bar white when the Close of a candle is outside of a respective ranging indicator option (Bollinger or Keltner).
The Trend Bars will draw white candles no matter which indicator selection you make (even "Off"). However, Range Bars will only draw white when either Bollinger or Keltner are selected.
The Donchian Channels and Super Trend are trending indicators and should be used during trending markets. I like to use the MACD in conjunction with these indicators for possibly earlier entries.
The Bollinger Bands and Keltner Channel are ranging indicators and should be used during ranging markets. I like to use the RSI in conjunction with these indicators and will use 60/40 for overbought and oversold areas rather than 70/30. During a range, I wait for an overbought or oversold indication and will buy/sell when it crosses back into the middle area and close my position when it touches the opposite band.
I have a MACD/RSI combination indicator if you'd like that as well :D
As always, trade at your own risk. This is not some secret indicator that will 100% win. As always, the trades you see in the picture use a 1:1.5 or 1:2 risk to reward ratio, for today (August 8, 2022) it won 5/6 times with one trade still open at the end of the day. Manage your account correctly and you'll win in the long term. Hit me up with any questions or suggestions. Happy Trading!
The Day Trade Highlight option will draw faint yellow between 9:15-9:25, red between 9:25-9:45, yellow between 9:45-10:05. There will be one white background at 9:30am to show the opening of the market. while the market is open there will be a very faint blue background. For the end of the day there will be yellow between 15:45-15:50, red between 15:50-16:00, and yellow between 16:00-16:05. During the night hours, there is no coloring. The purpose of this highlight is to show the opening / closing times of the market and the hot times for large moves.
The indicators can also be colored in the following ways:
1. Simple = Makes all colors for the indicator Gray
2. Trend = Will use the Donchian Channels to get the short-trend direction and by default will color the short-term direction as Blue or Red. Unless using Super Trend, the Donchian Channel is used to find short-term trend direction.
3. Trend Adv = Will use the Donchian Channels to get the short-trend direction and by default will color the short-term direction as Blue or Red. Unless using Super Trend, the Donchian Channel is used to find short-term trend direction. If there is a short-term up-trend during a long-term down-trend, the Blue will become Navy. If short-term down-trend during long-term up-trend, the Red will be Brown.
4. Squeeze = Compares the Bollinger Bands width to the Keltner Channels width and will color based on relative squeeze of the market: Teal = no squeeze. Yellow = little squeeze. Red = decent squeeze. White = huge squeeze. if you do not understand this one, try drawing the Bollinger Bands while using the Squeeze color option and it should become more apparent how this works. I also recommend leaving the length and multiplier to the default 20 and 2 if using this setting and only changing the timeframe to get longer/shorter lengths as I've seen that changing the length or multiplier can more or less make it not work at all.
Along with the indicator settings are options to draw lines/labels/fills for the indicator. I enjoy having only fills for a cleaner look.
The Labels option will show Buy/Sell signals when the short-term trend flips to agree with the long-term trend.
The Trend Bars option will do the same as the Labels option but instead will color the bars white when a Buy/Sell option is given.
The Range Bars option shows will color a bar white when the Close of a candle is outside of a respective ranging indicator option (Bollinger or Keltner).
The Trend Bars will draw white candles no matter which indicator selection you make (even "Off"). However, Range Bars will only draw white when either Bollinger or Keltner are selected.
The Donchian Channels and Super Trend are trending indicators and should be used during trending markets. I like to use the MACD in conjunction with these indicators for possibly earlier entries.
The Bollinger Bands and Keltner Channel are ranging indicators and should be used during ranging markets. I like to use the RSI in conjunction with these indicators and will use 60/40 for overbought and oversold areas rather than 70/30. During a range, I wait for an overbought or oversold indication and will buy/sell when it crosses back into the middle area and close my position when it touches the opposite band.
I have a MACD/RSI combination indicator if you'd like that as well :D
As always, trade at your own risk. This is not some secret indicator that will 100% win. As always, the trades you see in the picture use a 1:1.5 or 1:2 risk to reward ratio, for today (August 8, 2022) it won 5/6 times with one trade still open at the end of the day. Manage your account correctly and you'll win in the long term. Hit me up with any questions or suggestions. Happy Trading!
Informacje o Wersji
Wanted to include that today's trades were from 5:30am to end of day close.- Also Updated the Name and max_labels_count
Informacje o Wersji
Minor Changes:- Day Trade Highlight only works on charts 15m or below. Find it mostly is just noise on the screen at higher timeframes.
- Took the word "length" out of "Indicator length" in the settings.
- Rearranged the colors under the "Assign Colors" portion of the SuperTrend section of code
- Added a note to the transparency setting under the "Assign Colors" portion of the SuperTrend section of code
- I noticed that the colors for the Super Trend were backwards (red was for uptrend, blue was for downtrend), they have been fixed to correctly show red for downtrend and blue for uptrend.
Informacje o Wersji
Lots of updates:- Can change time to consider Day Light Savings
- Added VWAP indicator which is separate from the VWAP trend line and utilizes the "Mult" option for standard deviation bands.
- Changed some bar colors when signals are produced
- Added Super Trend alert options per request.
Informacje o Wersji
Quality of life improvements:- Added a "night time" to the day trading highlight -> Night time will show as darker on the chart than the day
- Added a "Cloud" indicator that will draw a cloud between the Trend EMA and the Indicator EMA
- Indicator EMA / HL2 / Cloud will now draw properly even if the "Draw Lines / Fill" boxes are not checked.
Informacje o Wersji
Added a tooltip for standard deviationInformacje o Wersji
Few changes just to make things a bit more intuitive. - Added Day Light Savings checkbox to the Highlight Day Trading option
- Rearranged the Indicator options so the first few are the trending indicators and the last few are the ranging indicators
Informacje o Wersji
Quick update, didn't add much just changed some default settings, changed the names of a few variables, and edited the screener to have a gray zone which would indicate it is near the respected time zone's 200 EMA. It will still show a green "Up" or red "Down" if above or below the 200 EMA. Now it shows gray when near the 200 EMA to indicate that maybe price is moving sideways in that timeframe or price is unsure if it will continue in a certain direction. Informacje o Wersji
Mainly changed the way the screener decides if the time frame is trending or ranging. Let me describe the old and new way.Old method:
Keltner based on Trend EMA, multiplier is always set to 1.5
- If [close] is above keltner upper band, then up trend
- If [close] is below keltner lower band, then down trend
- If [close] is inside keltner channel, then range
New method:
Keltner based on Trend EMA, multiplier is always set to 2.5
- If [close] is above keltner upper band, now in up trend
- If [close] is below keltner lower band, now in down trend
- If [close] closes across Trend EMA, then range
Reason for these changes:
Now that the multiplier is set to 2.5 rather than 1.5, it now makes the start of a Up / Down trend more strict (it's harder to reach further away from Trend EMA). So when it switches from Range to Up / Down, you know it's a more confident trend.
With the change of going from Trend to Range as crossing the Trend EMA rather than just being inside the Keltner Channel, this makes the switch from Up / Down to Range more confident as price now has to go all the way back to the EMA.
This should result in the Trend or Range indicator being more confident in both scenarios as now the initiation for each decision is now harder to reach. And on top of that, the Trend/Range changes should not flip back and forth as much since the price could ride along the Keltner bands making it flip quickly.
other small changes:
- Got rid of the bolinger squeeze color
- Can now color price bars based on trend or range, this is dependant on the indicator you've selected
Informacje o Wersji
Had to fix the trend screener changes I just made. Needed the If/else statements to end with the default option being the previous Trend value rather than "na"Informacje o Wersji
I added a new indicator -> Range Finder. It calculates the ATR using a length of 22. Then it multiplies that by the indicator multiplier you can set. Finally, it uses the indicator length which you can set to determine how long it must be within a ranging market to start highlighting it. I have found I like setting the indicator length to about 14-20 with a multiplier of 4 when using the Range Finder. Had to adjust the fill/channel color choosing madness, still cant figure out why my fill colors don't work for this indicator specifically. I feel like I've tried every combination of ways. I'm trying to set it so that the Range Finder will be on even if "Fill" is unchecked and then it will draw the red and blue zones if "Fill" is checked. But no matter what I do, it doesn't work that way.
So for now if you're using the new Range Finder indicator, you must check the box for "Lines" or "Fill" or both to see it. I also do not have any signals setup for this. I don't believe this is one you really should be signaling with, it's more of a verification for other signals you'd be taking like RSI signals while the Range Finder is showing price is in a range.
Made some minor changes like disabling night time highlighting, some other little clean up things not too noteworthy.
Informacje o Wersji
Update notes:Day trade highlight - Now has one checkbox instead of two. I have made it automatically detect daylight savings time and adjust the times accordingly.
Screener - Went from two checkboxes to a dropdown menu to select off or on. I removed the "Flipped" option to make it simpler. "On" now has two options. Previously, this only used Keltner, now it has that option or Donchian Channel. Here's some insight on how these now work:
Screener -> On - Keltner
Uses Keltner with 200 EMA and a 4x multiplier. If price goes above the upper channel, Trend is considered "up" until it crosses the EMA. While price is above the channel, the Trend indicator will be brighter than if it is simply in an uptrend but below the upper channel. Same goes for the downside, price goes below lower channel, Trend is considered "down" until it crosses the EMA. WHile price is below the channel, the Trend indicator will be brighter.
Once price (HLC3 of the candle) breaks the EMA, price will be considered ranging until it breaks the upper or lower channel again, signified by a gray Trend signal titled "--"
Screener -> On - Donchian
Uses Donchian with 200 length. If price closes (not crosses) above previous high channel, Trend is considered "up" until it crosses the middle line (HL2). If price closes (not crosses) below the previous low channel, Trend is considered "down" until it crosses the middle line (HL2).
Once price (HLC3 of the candle) breaks the middle line (HL2), price will be considered ranging until it closes above the upper or below the lower channels again, signified by a gray Trend signal titled "--"
I find the two types of screeners are often similar but can be nice if you like a specific calculation more than the other. Also, the Keltner provides that "super" up or down signal by being brighter when it is above/below the channel, just something neat.
I've turned off "barmerge.lookahead" as this can make the indicator seem better than it really is when doing replay testing.
I've removed the "bClose" option which made it so that the Donchian channel (or other trending based on it) would only change if the price closed past the previous high/low rather than simply crossing it. This is on by default now. I find it a better signal than simply crossing high/low.
Coloring
I've re-added the option to color your indicator a specific way. This used to be a feature but once upon a time I simply made it so that ranging indicators were gray and trending idicators were blue/red depending on the trend. I have also broken it into the following options:
Color: Simple
The indicator colors will be gray, simple as that haha.
Color: Trend
The indicator colors will be blue or red depending on if the current trend is up or down. The trend is specifically calculated using the donchian channels for all indicators except for the super trend which will do it's own colors respectfully. So if you pick any indicator (aside from the super trend) and then pick the "Trend" coloring option, it will be blue or red based on the donchian channels.
Color: Trend Adv
Same as Color: Trend but this time it will color the indicator a dark gray if the price (HLC3 of the candle) crosses the middle line of the donchian channel. It will remain the dark gray until a new up or down trend is started. The point of this coloring method is to give a sort of Trend vs Range indication.
Color: Squeeze
This option calculates the bollinger bands and keltner channel values for the given indicator length and multiplier. Then it works by comparing if the bollinger bands are inside the keltner channel at 1.5x, 1.0x, or 0.75x mutlipliers. If it is, it will color the indicator yellow, orange, or red based on how tight the bollinger is relative to the keltner channel. The point of this coloring method is to indicate a market squeeze where price action has slowed. This would be similar to an Average True Range (ATR) value showing candle sizes getting bigger/smaller.
I've moved the indicator options around and made a few of them dropdown menus rather than checkboxes. I feel it is a bit cleaner this way. If you have any questions on the layouts, check the "i" symbol on the right for some information. The settings should go like this:
Indicator selection - drawing option (fill, lines, both) - coloring option
indicator length - indicator multiplier (if applicable) - timeframe choice
signal option
Currently the signal option only works on a couple of the indicators, I can look into adding more but I usually don't use those indicators so they got put on the bottom of my list.
Lastly, if you're looking at my code for the screener, it is very different than before. I used to have each item listed manually. Now I've set it up to use loops so it's less work if I want to make changes. Also, I made a change to how the "request.security" happens so now it only calls once per timeframe rather than three times per timeframe. This script already does A LOT so doing some effiency clean up is nice. There's a ton I could do more to be efficient, but heck it works so why put in the effort haha. Maybe one day.
Anyways, if you made it this far through my notes, your luck will bring you a spicy winning trade soon! Thank you so much for input and ideas. I look forward to continuing the trading path with you all
Informacje o Wersji
Tiny change:I've made it so that if you are using the Trend or Trend Adv colors and the indicator of choice has an EMA in it, it will use the Keltner to determine trend. if you have Super Trend, it will still use Super Trend for trend colors.
Donchian, HL2, VWAP will use Donchian for trend colors.
Keltner, Bollinger, EMA, Cloud will use Keltner for trend colors.
Super Trend uses itself.
Range Finder only uses it's own colors, no changing these currently.
Informacje o Wersji
- Updated from pinescript version 5 to version 6.- Updated the way VWAP is calcaulted and also made it so that you can anchor it to the 9:30a Nwe York open rather than the usual "Session" which is 6pm, at least on the stuff I trade.
- Cleaned up a lot of the higher timeframe requests: if something uses bands (Keltner or Bollinger for example), it now makes one request for the high, middle, and low values rather than one request for each. I did this in several spots in my code. This helps speed up the indicator on slower machines.
- Switched the Keltner Channel's range to use the RMA of the True Range rather than the EMA of the True Range. RMA is the usual calculation of Keltner and that's why this is now updated.
- Added an entirely new section called OHLC:
OHLC allows you to draw the Open, High, Low, Close of the previous day onto the current day. These can act as points of interest or even support / resistance. The Open is set at 9:30am New York time, close is set at 4:00pm. This is because I trade the S&P 500 which is traded during these times. Yes I know there's overnight trading but most volume happens during these times.
The highs and lows can actually look back further than one day. I did add this multiplier option (it has a maximum of five) because sometimes when the "day's" values get reset, you miss out on a high or low that happens afterwards. I have mine reset at 6:00am and then my highs/lows reset 1.5 days back. These settings are 24 hour so let's say you want to reset at 9:45pm, you put the Reset Time to 21 and 45.
Color options are available for the OHLC + Text used for the lines and labels. Linewidth is 1 and they are dashed lines. Feel free to go into the style tab to change these, it should be right at the top. I don't know how these managed to be at the top of the whole Style tab since they are nearly the last thing in the script but whatever.
I used to always draw a ray on my chart for these and would move them each morning. Now I have it here and it works automatically for me!
Big update here:
I've updated the Screener to include a new line at the bottom titled "Trade" with a value of which way you should be taking trades. I did this because even though I had all the timeframes showing me which way they were trending, I still ignored them. Not sure why but I did...
Trade Values and their respective rules in this order:
1m is ignored, simply shown for your own trading purposes
5m + 15m are the Lower Timeframes (LTF)
1h + 4h are the Higher Timeframes (HTF)
Sit Out - If both HTFs match Up or Down while the LTFs also match Up or Down but are opposite of the HTF (i.e. LTFs = Up while HTFs = Down). The purpose of this one is to say that the short term trends are disagreeing with the long term trends. This usually happens during large sudden spikes in price and often leads to weird conditions that are not worth trading. This one will be a bright Purple color to quickly differenciate it from the other trend signals.
All Long / Short - All timeframes are aligned. All Up or all Down
Range Long / Short - HTFs match Up or Down while both LTFs are ranging. This is an indication that you are in a range but the HTFs are still considered trending. Expecting ranging conditions but take the trades in the direction of the HTFs.
Long / Short - The LTFs match Up or Down but only one of the HTFs agree. This one is saying that the trend is weaker than other signals but still has a direction you should stick to.
Ranging - If none of the other conditions above are met, then it is considered a ranging market. I find that if the Trend value reads "Ranging" then it's pretty accurate. Feel free to use a ranging strategy and take trades going both long and short until a new trend is declared.
If you're using the Keltner as your screener (which I do recommend, it's the EMA length of whatever you set the Trend EMA value to and the channels are a multiplier of 4), then you'll notice that the Up / Down trends can have a brighter Green / Red signal. This is to indicate if it is outside of the Keltner bands currently to show that not only is it trending, but it is trending heavily in that direction. I have also changed it so that when it is Up / Down that it will add a "+" to the trend as well as get brighter to make it more obvious. This does not apply to the Donchian screener as you can't go outside of the Donchian channel.
If you have suggestions or requests, feel free to add a comment, not sure how often I will check but if I pass by one and make the change I'll let you know!
Happy trading everyone. I'm always working on this and my "MACD+RSI with Divergences" indicator. So if you're looking to catch any updates or new indicators I'm working on, these are the two to watch for. I try to take anything new and add it to these two so you have everything all in two indicators since that is the limit of free accounts.
Informacje o Wersji
Forgot to add another Trade value in my notes from the last update:Between Range Long / Short and the final Long / Short conditions, there is one more:
HTF Long / Short - This is when the Higher Timeframes match Up or Down while the Lower Timeframes are mismatched amongst themselves. This is still a better trend than the standard "Long / Short" as it still has the higher timeframes aligned but it's not as good as all timeframes being aligned. It also is not quite ranging since it may have one of the Lower Timeframes aligned, but it isn't necessary to be that way. If both Lower Timeframes were Ranging then it would lead to the Ranging Long / Short value instead, so this is still more of a trend than that.
Informacje o Wersji
TLDR: I made it so settings are disabled if they are inactive for the given setup you have. Default 100 Trend Length rather than 200. Made some huge changes to how the screener calculates the given trend/range bias. Now uses a scoring system rather than a rule-based system.Changed the default trend length to 100 as I see it is fitting my trading style better, especially with the changes I've made to my screener (listed below).
I've recently figured out how to have "Active" variables. Now when you open up the indicator settings, options may be grayed out if they are ineffective with the current settings. For example, if you have the indicator selection set to "Off" then all of the indicator options will be grayed out. If you set it to Donchian, for example, the Multiplier option will be grayed out. Set it to something like Keltner, or VWAP, and you'll see the Multiplier option available.
Simplified some of the code for the buy/sell signals. Won't effect live trading signals, just makes the code work with less lines. Old code is still there just commented out.
Screener - Big changes to this
I'll first describe how the screener used to work and then describe how it works now, this should help explain why I made the changes.
- HTF = Higher Timeframe
- LTF = Lower Timeframe
Screener: Before
HTF is 60m and 240m. LTF is 5m and 15m.
HTF Trend = 60m and 240m are in agreement on trend direction
LTF Trend = 5m and 15m are in agreement on trend direction
Rules in specific order:
- HTF Trend and LTF Trend disagree = sit out
- Both HTF and LTF Trends agree = Super strong trend, only trade this direction
- HTF Trend only = HTF Trend, take trades in this direction but expect deep pullbacks
- LTF Trend + one of the HTF agree but not both = Take trades in this direction, expect average trend action
- Ranging - If none of the above conditions are met, then it is delcared a Range market.
I even played around with setting the timeframes being used from 5/15/60/240 to 1/5/15/60 to get a bit quicker trend analysis. It was quicker but it still felt like it could use some work.
Screener: After
What I came up with was to use all five timeframes: 1/5/15/60/240 but giving each of them a scaled value of -2 to +2.
Keltner Trend for each timeframe = Above keltner channel is +2, Up trend is +1, Ranging is 0, Down trend is -1, Below keltner channel is -2. This give each trend a value of -2 to +2.
Donchian Trend for each timeframe = Up trend is +2, Ranging is 0, Down trend is -2
I then take the sum of all values and give a range to trend strength. I do give extra weight to the 1m and 5m if the 1m, 5m, and 15m all agree on trend direction. The purpose of this is to give extra weight to what's happening right now if there are quick market movements. This gives the maximum score of 14 for either given direction.
I took away the Sit Out outcome even though I still have the calculation of it which is now: 60m and 240m agree while 1/5/15 agree in the opposite direction.
Scoring
Scoring goes positive and negative for Long/Short respectively (remember 14 is the max score):
- 12 -> All Long/Short - in on one direction, expect little to no pullbacks. Market is probably ripping in the given direction. If you were already in the given trend direction when the screener switches to All Long/Short, hold onto that trade, let it ride a bit further than you usually do since the trend is so one sided.
- 9 -> Strong Long/Short - strong trend direction, expect short pullbacks, definitely stick with the trending direction
- 6 -> Long/Short - average trend direction, normal trending conditions and setups with possibly deep pullbacks, probably want to stick to the given direction
- 4 -> Range Long/Short - expect ranging conditions, use a ranging strategy but you should probably only take trades in the long/short direction as stated by screener
- Less than 4 -> Ranging - market is ranging, use a ranging strategy and feel free to take trades going Long or Short as you see entry signals either way.
I trade the 1m chart and have seen great success by switching from the 200 length Keltner screener to the 100 length Keltner screener. I still haven't messed around with the Donchian screener much, results may vary I suppose. I think Keltner is the better choice as any given timeframe can be -2, -1, 0, +1, or +2 whereas Donchian can only be -2, 0, +2 so it's not as intricate in its scoring method.
Informacje o Wersji
This update looks to make tons of changes to the Screener:- Screener now uses the Trend Length as the Screener Length instead of being stuck at my defined 100 or 200 lengths.
- Also added an option to change the Screener's multiplier which is used for the Keltner options. By default, I've always used a value of 4.0; I do still like 4.0 but I thought some people might like to change it.
- Added a new option called "Keltner 200 vs Trend". This option will calculate the trend values for each timeframe usng the 200 length as well as whatever length you have the "Trend Length" set to. Then it will take the average of both of those scores for each timeframe. It can be worth looking at. I tend not to use it but I was doing some testing with it while trying to decide if I like the 200 or 100 length better. Ended up just adding an option that takes the average of both instead of settling for using the 150 length.
- Added Custom Weighting - The default scoring gives each timeframe a score of -2 to +2, scoring notes are in previous update notes above. The new weighting system uses the same -2 to +2 score calculates but adds more to them afterwards: If there are LTF or HTF agreements, extra points will be added to select timeframes. The purpose is that during a move that multiple timeframes agree on (for example, the 1/5/15m timeframes all align), they will be given extra points to indicate that something is happening right now and deserves extra attention.
- Added the ability to show the scores for each timeframe and the total using the "Scores" option. The trend analysis for each timeframe and overall status already give statuses by using text and color displays. Showing the scores is more of a formality if you would rather just see how everything is working quickly. The trend score required to hit certain trend analysis is adjusted to fit the new custom weighted scoring system if you enable it.
- Added an option to include or remove the 4-hour timeframe from the screener. Since I day trade (only during NY session and trades last minutes to a couple hours), I found the 4-hour timeframe to just be so far lagging it was throwing off my screener analysis. For example, I've been liking the 100 length for the screener, that's 3-4 weeks on the 4-hour timeframe.
- Added an option to include 5m Structural Scoring. The reason for picking 5m timeframe for the structural analysis is that 5m at 100 length is a little over 8 hours. During the opening time, this inclues the morning and pre-market price action. By the end of the day, around 3:30pm, this includes everything from pre-market to almost close so it's perfect for my day trading style. The 5m Structure looks for Higher Highs with Higher Lows or Lower Highs with Lower Lows. If price structure is showing bullish or bearish, it will give a respective -2 to +2 score added to the final score.
- Cleaned up a few functions to be a little more efficient or at least look cleaner in the code.
- Removed the bFlip variable completely - I already had this hardcoded as disabled but now I simply removed it from the script code and any affected functions that used it.
Also note that if you have any questions, I did put TONS of info in tooltips next to any new or existing options within the settings of the indicator.
Informacje o Wersji
Made some small changes to the way the 5m Structure is calculated with the Screener. It should reflect price action a little better. Also made it so that the 5m Structure score gets a bit more value if it agrees with the current trend OR if the overall trend score is zero. These changes allow the 5m Structure score to give more weight during trends, or be the only given weight during a completely ranging market. This should also allow it to give an early indication to an upcoming trend direction if the market is truly ranging. Also removed the yellow highlight that was set at the Trend length. I had this as I was testing some different trend lengths for my own purposes.
Skrypt open-source
W zgodzie z duchem TradingView twórca tego skryptu udostępnił go jako open-source, aby użytkownicy mogli przejrzeć i zweryfikować jego działanie. Ukłony dla autora. Korzystanie jest bezpłatne, jednak ponowna publikacja kodu podlega naszym Zasadom serwisu.

Wyłączenie odpowiedzialności
Informacje i publikacje nie stanowią i nie powinny być traktowane jako porady finansowe, inwestycyjne, tradingowe ani jakiekolwiek inne rekomendacje dostarczane lub zatwierdzone przez TradingView. Więcej informacji znajduje się w Warunkach użytkowania.
Skrypt open-source
W zgodzie z duchem TradingView twórca tego skryptu udostępnił go jako open-source, aby użytkownicy mogli przejrzeć i zweryfikować jego działanie. Ukłony dla autora. Korzystanie jest bezpłatne, jednak ponowna publikacja kodu podlega naszym Zasadom serwisu.
Wyłączenie odpowiedzialności
Informacje i publikacje nie stanowią i nie powinny być traktowane jako porady finansowe, inwestycyjne, tradingowe ani jakiekolwiek inne rekomendacje dostarczane lub zatwierdzone przez TradingView. Więcej informacji znajduje się w Warunkach użytkowania.