OPEN-SOURCE SCRIPT
[ A L P H A X ] Institutional Confluence Suite
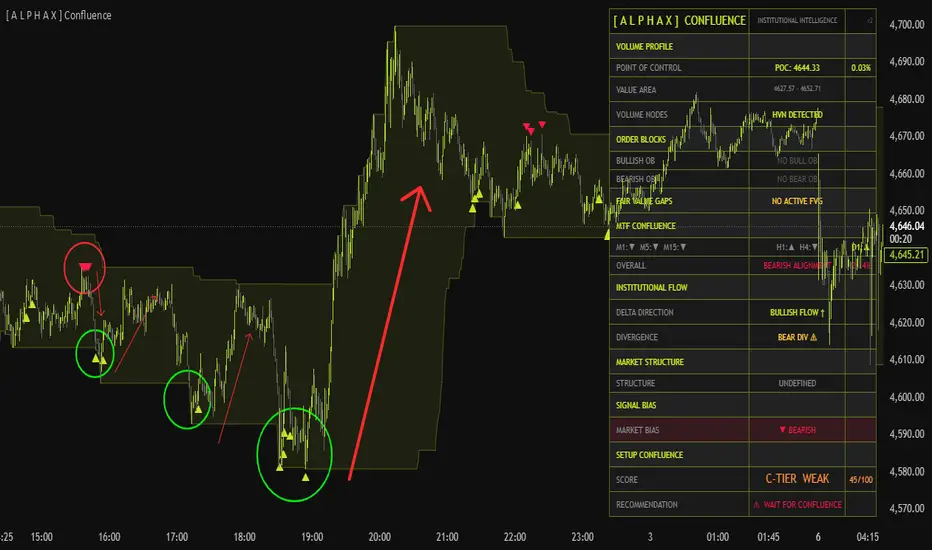
[ A L P H A X ] Institutional Confluence Suite — Volume Profile · Order Blocks · FVG · MTF Matrix · Flow Analysis · Smart Signals
The AlphaX Institutional Confluence Suite is a professional-grade multi-layer analysis system built around one core principle: no single tool gives you an edge — confluence does. This indicator fuses six independent institutional analysis engines into a unified real-time dashboard, scoring each bar from 0 to 100 and surfacing only the setups where everything lines up. Designed to be used alongside AlphaX PRIME for the highest-probability entries in the AlphaX ecosystem.
━━━━━━━━━━━━━━━━━━━━━━━━━━━━━━━━━━━━━━━━
📸 What You See On The Chart

━━━━━━━━━━━━━━━━━━━━━━━━━━━━━━━━━━━━━━━━
🔬 The Six Engines — How Each One Works
━━━━━━━━━━━━━━━━━━━━━━━━━━━━━━━━━━━━━━━━
1 ─ Volume Profile (VPVR) — Where Is The Real Money?
The Volume Profile calculates exactly how much volume traded at every price level across your configured lookback window. This is the same tool institutional desks use to identify where liquidity has accumulated.
Scoring contribution: up to 20 points
Full 20 points when price is within 0.5% of the POC. Scaled down with distance.
━━━━━━━━━━━━━━━━━━━━━━━━━━━━━━━━━━━━━━━━
2 ─ Order Blocks — Institutional Footprints
Order Blocks are the last candle before a strong impulsive move — the candle where an institution placed a large directional order. When price returns to that zone, the institution defends its position, creating a high-probability reaction.
Scoring contribution: up to 20 points
Full 20 points when price is inside the OB zone. Scaled by proximity.
━━━━━━━━━━━━━━━━━━━━━━━━━━━━━━━━━━━━━━━━
3 ─ Fair Value Gaps (FVG) — Price Imbalance Zones
A Fair Value Gap is created when price moves so fast that no two-sided trading occurs — leaving a "gap" in the market that price statistically tends to return and fill. FVGs are one of the most powerful short-term magnets in price action analysis.
Dashboard contribution: FVG count display (Bull/Bear active gaps)
━━━━━━━━━━━━━━━━━━━━━━━━━━━━━━━━━━━━━━━━
4 ─ Liquidity Sweeps — Stop Hunts & Reversals
Liquidity Sweeps occur when price briefly breaks a key swing high or low — triggering stop losses clustered there — before immediately reversing. This is the market's most reliable short-term reversal pattern because it is driven by mechanics, not sentiment.
━━━━━━━━━━━━━━━━━━━━━━━━━━━━━━━━━━━━━━━━
5 ─ Multi-Timeframe Confluence Matrix — Are All Timeframes Aligned?
The MTF Matrix queries six timeframes simultaneously — M1, M5, M15, H1, H4, and D1 — and evaluates price position relative to both the 50 EMA and 200 EMA on each. Higher timeframes are weighted more heavily because they represent more significant institutional positioning.
Scoring contribution: up to 20 points
Full 20 points when MTF alignment matches the price-POC relationship (e.g., fully bullish AND price is above POC).
━━━━━━━━━━━━━━━━━━━━━━━━━━━━━━━━━━━━━━━━
6 ─ Institutional Flow — Volume Delta & Divergence
The Flow engine estimates the directional bias of volume on each bar using the close position within the bar's range — a proxy for buy-side vs. sell-side pressure. This is then smoothed to produce a clean directional flow signal and tracked for divergence against price.
Scoring contribution: up to 20 points
━━━━━━━━━━━━━━━━━━━━━━━━━━━━━━━━━━━━━━━━
7 ─ Market Structure — BOS & CHoCH
The Market Structure engine tracks the sequence of swing highs and swing lows to determine whether the market is in a bullish or bearish structural trend, and detects when that structure breaks.
Scoring contribution: up to 20 points
━━━━━━━━━━━━━━━━━━━━━━━━━━━━━━━━━━━━━━━━
🧠 Confluence Scoring System — 0 to 100
Every bar is scored in real time by summing contributions from all six engines:
Score Tiers:
━━━━━━━━━━━━━━━━━━━━━━━━━━━━━━━━━━━━━━━━
📊 Signal Generation — When Does A Triangle Appear?
Signals require ALL of the following to be true simultaneously:
This means triangles are rare and meaningful — not every bar. When one appears, every major confluence factor has agreed on the same direction at the same time.
Triangle size = tier:
━━━━━━━━━━━━━━━━━━━━━━━━━━━━━━━━━━━━━━━━
🚀 How To Trade — Step By Step
Step 1 — Check The Dashboard For Context
Step 2 — Identify The Key Level
Step 3 — Wait For The Trigger
Step 4 — Enter On The Signal Triangle
Step 5 — Place Your Stop Loss
Step 6 — Manage The Trade
Step 7 — Know When NOT To Trade
━━━━━━━━━━━━━━━━━━━━━━━━━━━━━━━━━━━━━━━━
🛡 Used As A Filter — Pairing With AlphaX PRIME
The Confluence Suite is designed to work alongside AlphaX PRIME as a two-layer system:
The three rules:
This pairing eliminates the two biggest trading mistakes: entering good signals at bad locations, and entering bad signals at good locations.
━━━━━━━━━━━━━━━━━━━━━━━━━━━━━━━━━━━━━━━━
⚡ Key Features
━━━━━━━━━━━━━━━━━━━━━━━━━━━━━━━━━━━━━━━━
⚙ Settings Reference
Volume Profile
Order Blocks
Fair Value Gaps
Liquidity Sweeps
MTF Confluence Matrix
Institutional Flow
Market Structure
Signals
Dashboard
━━━━━━━━━━━━━━━━━━━━━━━━━━━━━━━━━━━━━━━━
🔔 Alert Conditions
All alert messages include {{ticker}} and {{interval}} placeholders for webhook integration.
━━━━━━━━━━━━━━━━━━━━━━━━━━━━━━━━━━━━━━━━
🎯 Recommended Settings By Instrument
XAUUSD (Gold) — 1m / 5m
Forex Majors — 5m / 15m
Indices (NAS100, US30) — 1m / 5m
Higher Timeframes (H1 / H4)
━━━━━━━━━━━━━━━━━━━━━━━━━━━━━━━━━━━━━━━━
👥 Who This Is For
━━━━━━━━━━━━━━━━━━━━━━━━━━━━━━━━━━━━━━━━
📝 Notes
━━━━━━━━━━━━━━━━━━━━━━━━━━━━━━━━━━━━━━━━
⚠ Disclaimer
This indicator is a technical analysis and visualization tool intended for educational and informational purposes only. It does not constitute financial advice or a recommendation to buy or sell any financial instrument. All signals are generated from historical and real-time price data using mathematical calculations — their accuracy or profitability is not guaranteed. Past performance of any signal type does not guarantee future results. Always conduct your own analysis, use proper risk management, and consult a licensed financial advisor before making any trading decisions. The author accepts no responsibility for any losses incurred from the use of this indicator.
━━━━━━━━━━━━━━━━━━━━━━━━━━━━━━━━━━━━━━━━
Six engines. One score. Only the best setups make it through.
The AlphaX Institutional Confluence Suite is a professional-grade multi-layer analysis system built around one core principle: no single tool gives you an edge — confluence does. This indicator fuses six independent institutional analysis engines into a unified real-time dashboard, scoring each bar from 0 to 100 and surfacing only the setups where everything lines up. Designed to be used alongside AlphaX PRIME for the highest-probability entries in the AlphaX ecosystem.
━━━━━━━━━━━━━━━━━━━━━━━━━━━━━━━━━━━━━━━━
📸 What You See On The Chart
- POC line — bright yellow-green horizontal line at the highest-volume price of the lookback range
- Value Area fill — soft green shaded zone between VAH and VAL (68% of volume)
- HVN box — highlighted rectangle at the most significant high-volume node
- Order Block lines — dashed orange (bullish) and red (bearish) lines marking institutional order zones
- FVG boxes — translucent green (bullish) and red (bearish) rectangles where price left imbalance gaps
- Liquidity Sweep triangles — small triangles marking stop hunts above swing highs or below swing lows
- BOS dots — tiny circles marking confirmed breaks of market structure
- Signal triangles — sized by tier (S / A / B), colored by direction — pure triangle up for bull, triangle down for bear. No text, no clutter.
- Confluence Dashboard — real-time panel showing every engine's status, individual scores, bias direction, and final tier rating
━━━━━━━━━━━━━━━━━━━━━━━━━━━━━━━━━━━━━━━━
🔬 The Six Engines — How Each One Works
━━━━━━━━━━━━━━━━━━━━━━━━━━━━━━━━━━━━━━━━
1 ─ Volume Profile (VPVR) — Where Is The Real Money?
The Volume Profile calculates exactly how much volume traded at every price level across your configured lookback window. This is the same tool institutional desks use to identify where liquidity has accumulated.
- Point of Control (POC) — the single price level with the highest traded volume. Price is magnetically drawn to the POC and tends to reverse or consolidate around it. Trading at the POC means you are operating at the most contested price in the range.
- Value Area High / Low (VAH / VAL) — the price band containing 68% of all volume. Prices inside the value area are "fair" to the market. Prices outside it are either discounts (below VAL) or premiums (above VAH) — and both tend to revert.
- High Volume Node (HVN) — the densest cluster of volume outside the POC. HVNs act as strong support and resistance because large orders were filled there. When price approaches an HVN, expect slower movement and potential reversal.
Scoring contribution: up to 20 points
Full 20 points when price is within 0.5% of the POC. Scaled down with distance.
━━━━━━━━━━━━━━━━━━━━━━━━━━━━━━━━━━━━━━━━
2 ─ Order Blocks — Institutional Footprints
Order Blocks are the last candle before a strong impulsive move — the candle where an institution placed a large directional order. When price returns to that zone, the institution defends its position, creating a high-probability reaction.
- Bullish Order Block — a bearish candle immediately followed by a strong bullish breakout. The low of that bearish candle is where buy orders were placed. When price returns to this zone, look for long entries.
- Bearish Order Block — a bullish candle immediately followed by a strong bearish breakdown. The high of that bullish candle is where sell orders were placed. When price returns, look for short entries.
- Strength Rating — each OB is scored by the momentum of the move that followed it. Higher strength = more institutional conviction = stronger expected reaction on revisit.
- IN ZONE ✓ — the dashboard highlights when price is currently inside an active order block, making the setup immediately actionable.
Scoring contribution: up to 20 points
Full 20 points when price is inside the OB zone. Scaled by proximity.
━━━━━━━━━━━━━━━━━━━━━━━━━━━━━━━━━━━━━━━━
3 ─ Fair Value Gaps (FVG) — Price Imbalance Zones
A Fair Value Gap is created when price moves so fast that no two-sided trading occurs — leaving a "gap" in the market that price statistically tends to return and fill. FVGs are one of the most powerful short-term magnets in price action analysis.
- Bullish FVG — the low of candle N+2 is above the high of candle N, leaving an unfilled zone below current price. Price tends to pull back into this gap before continuing higher.
- Bearish FVG — the high of candle N+2 is below the low of candle N, leaving an unfilled zone above current price. Price tends to rally into this gap before continuing lower.
- Only unfilled FVGs are displayed — the indicator automatically removes gaps once price has traded through them.
- A minimum size filter (configurable as an ATR multiple) prevents tiny, insignificant gaps from cluttering the chart.
Dashboard contribution: FVG count display (Bull/Bear active gaps)
━━━━━━━━━━━━━━━━━━━━━━━━━━━━━━━━━━━━━━━━
4 ─ Liquidity Sweeps — Stop Hunts & Reversals
Liquidity Sweeps occur when price briefly breaks a key swing high or low — triggering stop losses clustered there — before immediately reversing. This is the market's most reliable short-term reversal pattern because it is driven by mechanics, not sentiment.
- Bullish Sweep — price dips below a recent swing low (triggering stops), then closes back above it. The stops have been hunted. Price is now positioned to move higher with less resistance.
- Bearish Sweep — price briefly spikes above a recent swing high (triggering stops), then closes back below it. The squeeze is complete.
- Sweeps appear as small triangles on the chart and also feed into the signal generation logic — a sweep in the direction of overall confluence is one of the strongest entry triggers available.
━━━━━━━━━━━━━━━━━━━━━━━━━━━━━━━━━━━━━━━━
5 ─ Multi-Timeframe Confluence Matrix — Are All Timeframes Aligned?
The MTF Matrix queries six timeframes simultaneously — M1, M5, M15, H1, H4, and D1 — and evaluates price position relative to both the 50 EMA and 200 EMA on each. Higher timeframes are weighted more heavily because they represent more significant institutional positioning.
- Each timeframe receives a directional score based on whether price is above or below its EMAs
- The 200 EMA carries 1.5× the weight of the 50 EMA — macro structure matters more than short-term positioning
- Higher timeframes (H4, D1) carry 3–4× the weight of lower timeframes (M1, M5)
- The aggregate score is expressed as a percentage from −100% (fully bearish) to +100% (fully bullish)
- The dashboard shows each timeframe's arrow (▲ / ▼ / —) so you can instantly see where alignment breaks down
Scoring contribution: up to 20 points
Full 20 points when MTF alignment matches the price-POC relationship (e.g., fully bullish AND price is above POC).
━━━━━━━━━━━━━━━━━━━━━━━━━━━━━━━━━━━━━━━━
6 ─ Institutional Flow — Volume Delta & Divergence
The Flow engine estimates the directional bias of volume on each bar using the close position within the bar's range — a proxy for buy-side vs. sell-side pressure. This is then smoothed to produce a clean directional flow signal and tracked for divergence against price.
- Bullish Flow — smoothed delta is positive and rising. Buyers are in control of order flow.
- Bearish Flow — smoothed delta is negative and falling. Sellers are dominating.
- Bullish Divergence — price makes a lower low but flow makes a higher low. Sellers are losing conviction on the new lows — a bullish reversal is building.
- Bearish Divergence — price makes a higher high but flow makes a lower high. Buyers are losing steam at the new highs — a bearish reversal is building.
- Divergence signals are highlighted with a ⚠ warning in the dashboard and receive bonus points in the confluence score.
Scoring contribution: up to 20 points
━━━━━━━━━━━━━━━━━━━━━━━━━━━━━━━━━━━━━━━━
7 ─ Market Structure — BOS & CHoCH
The Market Structure engine tracks the sequence of swing highs and swing lows to determine whether the market is in a bullish or bearish structural trend, and detects when that structure breaks.
- Break of Structure (BOS) — a confirmed break of the most recent swing high (bullish BOS) or swing low (bearish BOS) in the direction of the existing trend. This confirms trend continuation.
- Change of Character (CHoCH) — a BOS that occurs against the current trend direction, signaling a potential trend reversal. The market has changed its behavior.
- Structure trend (bullish / bearish / undefined) is displayed in the dashboard and contributes to both the confluence score and the directional bias vote.
Scoring contribution: up to 20 points
━━━━━━━━━━━━━━━━━━━━━━━━━━━━━━━━━━━━━━━━
🧠 Confluence Scoring System — 0 to 100
Every bar is scored in real time by summing contributions from all six engines:
- Volume Profile (POC proximity) — up to 20 points
- Order Block (zone proximity) — up to 20 points
- MTF Alignment — up to 20 points
- Institutional Flow — up to 20 points
- Market Structure — up to 20 points
Score Tiers:
- S-TIER PRIME (80–100) — All or nearly all engines aligned. The highest probability setup available. Strong entry zone. Large triangle marker on chart.
- A-TIER HIGH (65–79) — Most engines aligned with minor divergence. High quality setup. Medium triangle.
- B-TIER MODERATE (50–64) — Partial alignment. Acceptable for experienced traders, prefer to wait for improvement. Small triangle.
- C-TIER WEAK (30–49) — Insufficient alignment. No signal fires. Wait for confluence to build.
- NO SETUP (0–29) — Do not trade. Multiple engines are contradicting each other.
━━━━━━━━━━━━━━━━━━━━━━━━━━━━━━━━━━━━━━━━
📊 Signal Generation — When Does A Triangle Appear?
Signals require ALL of the following to be true simultaneously:
- Confluence score meets or exceeds your configured minimum (default: 60/100)
- Directional bias vote is clear — majority of engines agree on direction (MTF, flow, structure, divergence all cast votes)
- A trigger event fires — either a Liquidity Sweep in the signal direction, OR a Break of Structure + bullish/bearish flow confirmation
- Signal cooldown has elapsed — prevents repeated signals on consecutive bars
This means triangles are rare and meaningful — not every bar. When one appears, every major confluence factor has agreed on the same direction at the same time.
Triangle size = tier:
- Large triangle = S-Tier (score ≥ 80) — highest conviction
- Medium triangle = A-Tier (score ≥ 65) — strong setup
- Small triangle = B-Tier (score ≥ 50 but < 65) — moderate setup
━━━━━━━━━━━━━━━━━━━━━━━━━━━━━━━━━━━━━━━━
🚀 How To Trade — Step By Step
Step 1 — Check The Dashboard For Context
- Open the dashboard panel. Read the OVERALL MTF alignment first — are all timeframes pointing the same direction?
- Check the SIGNAL BIAS row — is the directional vote clear or split?
- Check the SCORE — are you at B-Tier or better? If the score is below 50, no signal will fire and you should wait.
Step 2 — Identify The Key Level
- Is price near the POC? Near the VAH or VAL? Inside an Order Block? Near an unfilled FVG?
- The more of these levels that overlap at the same price, the stronger the potential reaction zone.
- The ideal setup is price approaching a POC + OB overlap from the correct direction.
Step 3 — Wait For The Trigger
- Watch for a Liquidity Sweep triangle (small triangle from the sweep engine) at or near your identified level.
- Or watch for a BOS dot confirming that structure has broken in your direction.
- Either of these is the "ignition" event that tells you momentum has shifted.
Step 4 — Enter On The Signal Triangle
- When a large (S-Tier) or medium (A-Tier) signal triangle appears, this is your primary entry.
- The triangle has already confirmed: score threshold met, bias agreed, trigger fired, cooldown clear.
- Enter in the direction of the triangle. For bullish triangles (▲), go long. For bearish triangles (▼), go short.
Step 5 — Place Your Stop Loss
- For long entries: stop below the Order Block low, or below the VAL, whichever is closer.
- For short entries: stop above the Order Block high, or above the VAH.
- Use the FVG zones as your first take-profit target — price tends to fill gaps before continuing.
Step 6 — Manage The Trade
- Watch the dashboard for any shift in the SIGNAL BIAS or a sudden drop in confluence score.
- If the score drops below 40 during your trade, consider reducing position or tightening your stop.
- If an opposing signal triangle appears, close the trade — the confluence has flipped direction.
Step 7 — Know When NOT To Trade
- Score below 50: no setup — wait.
- MTF matrix showing mixed signals (some ▲, some ▼ across timeframes): market is indecisive — wait.
- SIGNAL BIAS showing "— NEUTRAL": the engines disagree on direction — wait.
- No active OB detected and price is far from POC: no institutional level nearby — wait.
- FVG shows active gaps above AND below price: the market is caught between two magnets — wait.
━━━━━━━━━━━━━━━━━━━━━━━━━━━━━━━━━━━━━━━━
🛡 Used As A Filter — Pairing With AlphaX PRIME
The Confluence Suite is designed to work alongside AlphaX PRIME as a two-layer system:
- PRIME generates precise entry triggers — the timing layer
- CONFLUENCE provides the context and quality filter — the intelligence layer
The three rules:
- PRIME signal + S or A-Tier confluence = take the trade at full size
- PRIME signal + B-Tier confluence = reduce size or wait for score to improve
- High confluence zone + no PRIME signal yet = pre-position alert — watch for PRIME to trigger
- PRIME signal + score below 50 = skip — confluence does not support the entry
This pairing eliminates the two biggest trading mistakes: entering good signals at bad locations, and entering bad signals at good locations.
━━━━━━━━━━━━━━━━━━━━━━━━━━━━━━━━━━━━━━━━
⚡ Key Features
- 📊 Live Volume Profile (VPVR) with POC, Value Area (VAH/VAL), and High Volume Node detection
- 🟧 Institutional Order Block detection with strength scoring and zone proximity alerts
- ⬜ Fair Value Gap detection with automatic fill tracking — only unfilled gaps displayed
- 🌊 Liquidity Sweep detection — identifies stop hunts at swing highs and lows
- 🔢 Six-timeframe MTF matrix (M1 / M5 / M15 / H1 / H4 / D1) with dual-EMA scoring and higher-TF weighting
- 📈 Institutional Flow engine — volume delta proxy with divergence detection
- 🏗 Market Structure tracking — BOS and CHoCH with trend state memory
- 🧠 Real-time confluence scoring (0–100) across all engines simultaneously
- 🎯 S / A / B tier signal system — triangle size reflects setup quality
- 📋 Directional bias vote — majority-rules engine agreement required for signal
- ⏱ Configurable signal cooldown — prevents consecutive duplicate signals
- 🔔 Tier-based alerts — S / A / B tier bull and bear alerts fire independently for custom notification routing
- 🎨 Full AlphaX color theme — yellow-green for bullish, red for bearish, amber for caution, gray for neutral
- ⚙ Fully configurable — every engine can be independently enabled or disabled
━━━━━━━━━━━━━━━━━━━━━━━━━━━━━━━━━━━━━━━━
⚙ Settings Reference
Volume Profile
- Enable Volume Profile — master toggle
- Visible Range Lookback — number of bars used to build the profile (default: 100)
- Profile Rows — price resolution of the profile (default: 24)
- Show POC / Value Area / HVN — individual visibility toggles
- Value Area % — percentage of volume defining the value area (default: 68%)
Order Blocks
- Enable Order Block Detection — master toggle
- OB Lookback Period — bars to scan for order block candles (default: 20)
- Show Bullish / Bearish OB — individual direction toggles
- OB Extend Bars — how far right the OB lines extend (default: 20)
Fair Value Gaps
- Enable FVG Detection — master toggle
- FVG Min Size (ATR multiple) — minimum gap size to qualify (default: 0.3× ATR)
- FVG Extend Bars — how far right boxes extend (default: 30)
- Show Bullish / Bearish FVG — individual direction toggles
Liquidity Sweeps
- Enable Liquidity Sweep Detection — master toggle
- Swing Lookback — pivot lookback for identifying swing highs/lows (default: 20)
- Sweep Threshold — sensitivity for detecting the sweep and close-back (default: 0.5 ticks)
MTF Confluence Matrix
- Enable MTF Matrix — master toggle
- Include M1 / M5 / M15 / H1 / H4 / D1 — individual timeframe toggles
Institutional Flow
- Enable Flow Analysis — master toggle
- Flow Period — EMA period for delta smoothing (default: 14)
- Flow Smoothing — SMA period applied after EMA (default: 3)
Market Structure
- Enable Market Structure — master toggle
- Structure Lookback — bars used for swing detection context (default: 50)
Signals
- Enable Signal Markers — master toggle for triangle plotting
- Min Confluence Score to Plot — minimum score required for a triangle to appear (default: 60)
- Signal Cooldown (bars) — minimum bars between consecutive signals (default: 3)
Dashboard
- Show Confluence Dashboard — master toggle
- Dashboard Position — Top Right / Top Left / Bottom Right / Bottom Left
- Compact Mode — hides secondary rows for a smaller panel footprint
━━━━━━━━━━━━━━━━━━━━━━━━━━━━━━━━━━━━━━━━
🔔 Alert Conditions
- S-Tier Bull Signal — highest quality bullish confluence (score ≥ 80)
- A-Tier Bull Signal — strong bullish confluence (score 65–79)
- B-Tier Bull Signal — moderate bullish confluence (score 50–64)
- S-Tier Bear Signal — highest quality bearish confluence (score ≥ 80)
- A-Tier Bear Signal — strong bearish confluence (score 65–79)
- B-Tier Bear Signal — moderate bearish confluence (score 50–64)
- Any Confluence Signal — fires on any bull or bear signal regardless of tier
- Bullish Liquidity Sweep — stop hunt below swing low with close-back above
- Bearish Liquidity Sweep — stop hunt above swing high with close-back below
- Bullish BOS — break of structure to the upside
- Bearish BOS — break of structure to the downside
- Bullish Flow Divergence — price lower low with flow higher low
- Bearish Flow Divergence — price higher high with flow lower high
- Prime Setup Detected — fires when score crosses above 80 for the first time
All alert messages include {{ticker}} and {{interval}} placeholders for webhook integration.
━━━━━━━━━━━━━━━━━━━━━━━━━━━━━━━━━━━━━━━━
🎯 Recommended Settings By Instrument
XAUUSD (Gold) — 1m / 5m
- Lookback: 100, Rows: 24, Min Score: 60, Cooldown: 3
- All engines enabled, MTF full 6-timeframe
Forex Majors — 5m / 15m
- Lookback: 80, Min Score: 55, Cooldown: 5
- Disable M1 from MTF matrix for cleaner readings
Indices (NAS100, US30) — 1m / 5m
- Lookback: 120, Rows: 30, Min Score: 65
- Increase OB lookback to 30 for index session structure
Higher Timeframes (H1 / H4)
- Lookback: 200, Rows: 36, Min Score: 70, Cooldown: 2
- Disable M1 and M5 from MTF matrix
━━━━━━━━━━━━━━━━━━━━━━━━━━━━━━━━━━━━━━━━
👥 Who This Is For
- 🥇 Institutional-style traders — traders who already understand order flow, volume profile, and smart money concepts will find this system speaks their language natively
- 📊 Multi-timeframe traders — the MTF matrix makes top-down analysis automatic and quantified
- 🎯 Precision entry traders — the six-engine confluence requirement means signals are rare but high-quality
- 🧠 Systematic traders — the scoring system removes subjectivity and gives every setup a quantitative rating
- 📈 Trend and momentum traders — the structure and flow engines confirm that momentum supports the direction before a signal fires
- ⚠ Traders who struggle with overtrading — the minimum score requirement and cooldown mechanically prevent low-quality entries from appearing
- 🔗 AlphaX PRIME users — this indicator is the official confluence layer designed to work alongside PRIME as a complete two-part system
━━━━━━━━━━━━━━━━━━━━━━━━━━━━━━━━━━━━━━━━
📝 Notes
- All signals are generated on bar close — no repainting
- The Volume Profile recalculates on the final bar of each lookback window — on lower timeframes with many bars, allow a moment for the profile to initialize
- Order Block detection resets each bar and only draws levels within 5% of current price — this prevents stale OBs from causing chart zoom-out on instruments with large historical price ranges
- FVG boxes are automatically cleaned and redrawn each bar — only the most recent unfilled gap in each direction is displayed to avoid clutter
- MTF data uses barmerge.lookahead_off — no future data is used in any calculation
- Maximum 500 labels, lines, and boxes are maintained — on very long chart histories, oldest drawings are automatically removed by TradingView's limits
━━━━━━━━━━━━━━━━━━━━━━━━━━━━━━━━━━━━━━━━
⚠ Disclaimer
This indicator is a technical analysis and visualization tool intended for educational and informational purposes only. It does not constitute financial advice or a recommendation to buy or sell any financial instrument. All signals are generated from historical and real-time price data using mathematical calculations — their accuracy or profitability is not guaranteed. Past performance of any signal type does not guarantee future results. Always conduct your own analysis, use proper risk management, and consult a licensed financial advisor before making any trading decisions. The author accepts no responsibility for any losses incurred from the use of this indicator.
━━━━━━━━━━━━━━━━━━━━━━━━━━━━━━━━━━━━━━━━
Six engines. One score. Only the best setups make it through.
Skrypt open-source
W zgodzie z duchem TradingView twórca tego skryptu udostępnił go jako open-source, aby użytkownicy mogli przejrzeć i zweryfikować jego działanie. Ukłony dla autora. Korzystanie jest bezpłatne, jednak ponowna publikacja kodu podlega naszym Zasadom serwisu.

🌐 alphax.trading
Institutional Grade Signals --> Engineered for Retail
💎ᴠɪᴘ tradingview.com/v/TaXohZvb/
[ A L P H A X ] PRIME - Premium Signal Engine
🔢 alphax.trading/resources/calculators
AlphaX Calculators
Institutional Grade Signals --> Engineered for Retail
💎ᴠɪᴘ tradingview.com/v/TaXohZvb/
[ A L P H A X ] PRIME - Premium Signal Engine
🔢 alphax.trading/resources/calculators
AlphaX Calculators
Wyłączenie odpowiedzialności
Informacje i publikacje nie stanowią i nie powinny być traktowane jako porady finansowe, inwestycyjne, tradingowe ani jakiekolwiek inne rekomendacje dostarczane lub zatwierdzone przez TradingView. Więcej informacji znajduje się w Warunkach użytkowania.
Skrypt open-source
W zgodzie z duchem TradingView twórca tego skryptu udostępnił go jako open-source, aby użytkownicy mogli przejrzeć i zweryfikować jego działanie. Ukłony dla autora. Korzystanie jest bezpłatne, jednak ponowna publikacja kodu podlega naszym Zasadom serwisu.
🌐 alphax.trading
Institutional Grade Signals --> Engineered for Retail
💎ᴠɪᴘ tradingview.com/v/TaXohZvb/
[ A L P H A X ] PRIME - Premium Signal Engine
🔢 alphax.trading/resources/calculators
AlphaX Calculators
Institutional Grade Signals --> Engineered for Retail
💎ᴠɪᴘ tradingview.com/v/TaXohZvb/
[ A L P H A X ] PRIME - Premium Signal Engine
🔢 alphax.trading/resources/calculators
AlphaX Calculators
Wyłączenie odpowiedzialności
Informacje i publikacje nie stanowią i nie powinny być traktowane jako porady finansowe, inwestycyjne, tradingowe ani jakiekolwiek inne rekomendacje dostarczane lub zatwierdzone przez TradingView. Więcej informacji znajduje się w Warunkach użytkowania.