Zaktualizowano
Range Meter: DTR vs ATR + RVol - JAW Trades
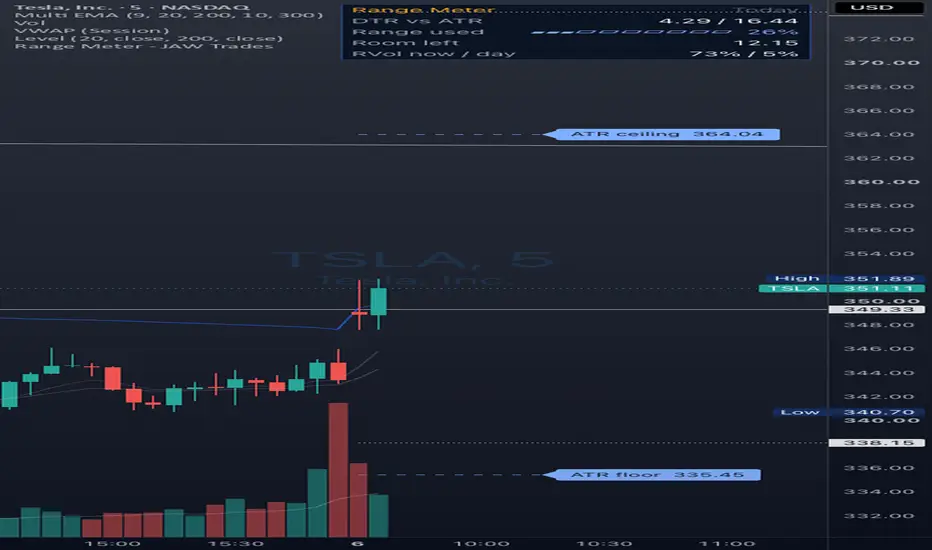
Before I take a trade I want to know two things: how much of its normal range the stock has already used today, and whether the volume is actually there. This shows both in one small panel.
What it shows
DTR vs ATR: today's range against the average range of the previous days. The ATR never includes today, so the number doesn't drift as the day moves.
Range used: the same thing as a percentage, with a meter bar. It turns gold when the move is getting stretched and red once it has used the full ATR.
Room left: how much range is left before a normal-sized day runs out, in price.
RVol now / day: the first number is volume so far today against the average volume by this same time on previous days. Comparing a half day with full days makes every morning look quiet, so this compares like with like. The second is today's volume against the average full day.
On the chart
Two dashed lines show the ATR ceiling (today's low plus one ATR) and the ATR floor (today's high minus one ATR). That's roughly where a normal day runs out of room in each direction.
Settings
By default everything uses the regular session only, like the daily candle, so premarket and after-hours highs, lows and volume don't count. You can switch extended hours on if you want them in.
ATR length and smoothing, the volume lookback, the stretched, full and heavy thresholds, line colour and style, and the panel's size and position. On weekly and monthly charts it switches to the week or month on its own.
Alerts are available for range used reaching your stretched or full level, and for RVol now turning heavy.
These are context, not buy or sell signals. For education only, not financial advice.
What it shows
DTR vs ATR: today's range against the average range of the previous days. The ATR never includes today, so the number doesn't drift as the day moves.
Range used: the same thing as a percentage, with a meter bar. It turns gold when the move is getting stretched and red once it has used the full ATR.
Room left: how much range is left before a normal-sized day runs out, in price.
RVol now / day: the first number is volume so far today against the average volume by this same time on previous days. Comparing a half day with full days makes every morning look quiet, so this compares like with like. The second is today's volume against the average full day.
On the chart
Two dashed lines show the ATR ceiling (today's low plus one ATR) and the ATR floor (today's high minus one ATR). That's roughly where a normal day runs out of room in each direction.
Settings
By default everything uses the regular session only, like the daily candle, so premarket and after-hours highs, lows and volume don't count. You can switch extended hours on if you want them in.
ATR length and smoothing, the volume lookback, the stretched, full and heavy thresholds, line colour and style, and the panel's size and position. On weekly and monthly charts it switches to the week or month on its own.
Alerts are available for range used reaching your stretched or full level, and for RVol now turning heavy.
These are context, not buy or sell signals. For education only, not financial advice.
Informacje o Wersji
Fixed: in Bar Replay and on older bars, the ATR ceiling and floor could use the previous day's high and low at the start of a new day. Today's high, low and volume now come from the chart's own bars.
Wyłączenie odpowiedzialności
Informacje i publikacje nie stanowią i nie powinny być traktowane jako porady finansowe, inwestycyjne, tradingowe ani jakiekolwiek inne rekomendacje dostarczane lub zatwierdzone przez TradingView. Więcej informacji znajduje się w Warunkach użytkowania.
Wyłączenie odpowiedzialności
Informacje i publikacje nie stanowią i nie powinny być traktowane jako porady finansowe, inwestycyjne, tradingowe ani jakiekolwiek inne rekomendacje dostarczane lub zatwierdzone przez TradingView. Więcej informacji znajduje się w Warunkach użytkowania.