Zaktualizowano
Multi-Timeframe High/Low Marker
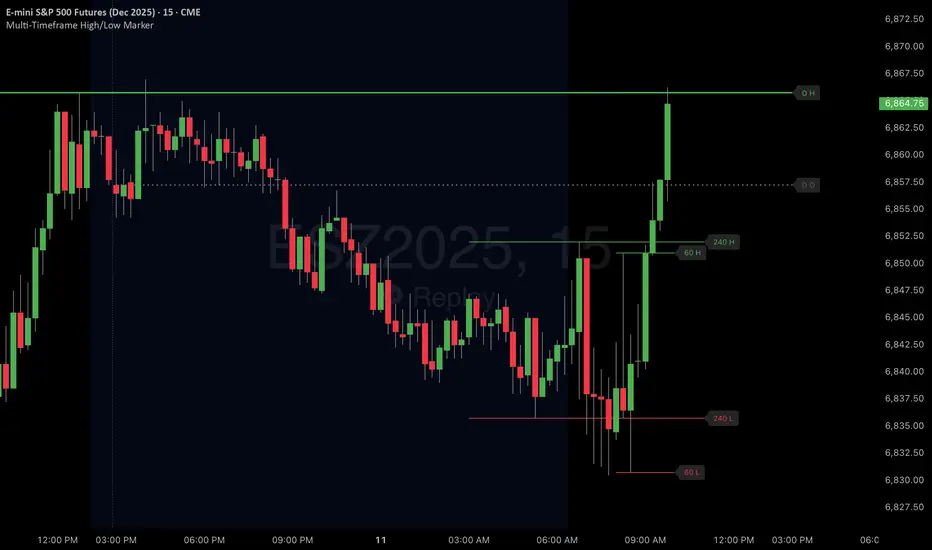
Description
This indicator displays the previous period's high and low price levels from up to three different timeframes simultaneously. Lines extend from the previous period through the current period, providing clear visual reference points for key price levels across multiple time horizons.
Utility
Identify price ranges and key levels from multiple periods.Reduce chart switching by displaying multiple ranges on a single chart.
Function
This indicator displays the previous period's high and low price levels from up to three different timeframes simultaneously. Lines extend from the previous period through the current period, providing clear visual reference points for key price levels across multiple time horizons.
Utility
Identify price ranges and key levels from multiple periods.Reduce chart switching by displaying multiple ranges on a single chart.
Function
- Track up to 3 different timeframes simultaneously (default: 1H, 4H, Daily)
- Customize each timeframe's high and low line colors, width, and style (solid/dashed/dotted)
- Optional current period opening price display for each timeframe
- Smart overlap detection prevents duplicate lines when multiple timeframes share the same price level
- Each timeframe can be individually enabled or disabled
- All visual elements fully customizable through indicator settings
Informacje o Wersji
DescriptionThis indicator displays the previous period's high and low price levels from up to three different timeframes simultaneously. Lines extend from the previous period through the current period, providing clear visual reference points for key price levels across multiple time horizons.
Utility
This is a simple but powerful indicator which will automatically draw significant price levels on timeframes of your selection:
- Identify price ranges and key levels from multiple periods
- Reduce chart switching by displaying multiple ranges on a single chart
- Visualize where current price sits relative to significant historical levels
- Understand market structure by seeing how different timeframe ranges interact
- Plan trades using confluence of levels from multiple timeframes
- Track price action relative to opening prices across different periods
Function - Track up to 3 different timeframes simultaneously (default: 1H, 4H, Daily)
- Customize each timeframe's high and low line colors, width, and style (solid/dashed/dotted)
- Optional current period opening price display for each timeframe
- Smart overlap detection prevents duplicate lines when multiple timeframes share the same price level
- Each timeframe can be individually enabled or disabled
- Optional price labels at line ends for quick reference
- Automatic cleanup of old lines as new periods begin
- Only displays on appropriate timeframes (e.g., daily levels hidden on daily+ charts)
- All visual elements fully customizable through indicator settings
Informacje o Wersji
Fixes an issue where some timeframes could not be drawn on the current timeframe shown.Informacje o Wersji
- Fixed an issue where daily levels would not display properly on equities (e.g. SPY) by using time-based coordinates instead of bar calculations
- Resolved errors when using weekly/monthly timeframes
- Updated overlap detection to apply to opening prices, and removed 5-tick threshold (now only exact price levels are considered overlapping)
Informacje o Wersji
v2.0 Update - Major ImprovementsSix Timeframes: Track high/low/open levels across up to 6 different timeframes simultaneously with independent styling
Smart Labeling: When multiple timeframes share the same price level, labels combine (e.g., "W+D+60 H") with higher timeframes taking priority for better visibility
Floating Labels: Dynamic labels that follow price levels with customizable positioning (vertical/horizontal offsets)
Performance: Optimized rendering with improved label management and efficient overlap detection
Improved Settings Panel: Enhanced UI layout with better spacing and organization
Please report any bugs or display issues you find!
Informacje o Wersji
Enable or Disable Matching Timeframe DisplayNew optional setting to display lines even when your chart timeframe matches a configured timeframe (e.g., view Daily lines while on a Daily chart). When enabled, shows the matching timeframe plus all higher timeframes, while still hiding lower timeframes for clean visualization.
Informacje o Wersji
Bug Fix: Fixed label combining issue where floating labels and period labels showed different information when both were enabled. Labels now correctly combine across all timeframes (e.g., "240+60 H") regardless of which label type is active.Improved terminology and made default selections more consistent throughout.
Informacje o Wersji
Bug Fix: Labels for Match TimeframeFixed an issue where labels were showing duplicate data when 'Match Timeframe' was enabled.
Informacje o Wersji
Bug FixFixed an issue where lower timeframes were included in labels when viewed on a higher timeframe.
Informacje o Wersji
Image updated to comply with TradingView guidelines.Informacje o Wersji
Added configurable label sizeYou can now adjust the text size of all labels (timeline and floating) via a new "Label Size" dropdown in Label Settings. Options include all standard TradingView label sizes: Auto, Tiny, Small, Normal, Large, and Huge.
Informacje o Wersji
v3.0 Update: Alerts, Session Handling, Lighter ScriptALERTS
The most requested feature update. One alert now covers everything. Pick your desired settings in indicator settings, then create an alert on this indicator. Pick "Any alert() function call" and follow this process to set additional alerts with different settings.
- Level Taken: price takes out a prior high or low for the first time in the period. Choose Intrabar (the moment it trades through) or Bar Close.
- Failed Break: after taking one side, a chart bar closes back inside the prior range (a failed 2).
- Open Cross: off by default. A chart bar closes on the other side of a timeframe's open. Needs Show Open on that timeframe.
Each level alerts once per period. When several timeframes share a level, the alert reads like the labels do: "Took W+D high 512.30 (2u)".
- Filters: which timeframes alert, direction (bullish or bearish), and an optional time window with its own time zone.
- Separate conditions: five alert conditions are also available if you want to route events to different places.
SESSIONS
- Roll Levels After Close: Auto by default. Once a period reaches its scheduled close (evenings, weekends, holidays), the period that just closed shows as the prior levels, so you can plan the next session before it opens. The same setting keeps monthly and longer levels current on a weekly chart when a month ends mid-week. Set it to Off for Bar Replay.
- Line ends: lines now run to each period's scheduled close, so futures holiday sessions and 31-day months no longer end a day early.
UNDER THE HOOD
- Lighter: drawing now happens only on the latest bar instead of on every historical bar, and data requests dropped from 12 to 6.
- Fix: timeline labels sometimes named a timeframe that isn't shown on the current chart. The floating labels got this fix in November.
If something looks off on your symbol, tell me in the comments.

Tools for traders and investors smart enough to keep it simple 😘👌
➡️ SETUP SCREENER GUIDE: TheStratSuite.com/scanner/guide
🤑 TheStrat Suite is now FREE & open source: TheStratSuite.com
345strategies.com · github.com/345-strategies
➡️ SETUP SCREENER GUIDE: TheStratSuite.com/scanner/guide
🤑 TheStrat Suite is now FREE & open source: TheStratSuite.com
345strategies.com · github.com/345-strategies
Wyłączenie odpowiedzialności
Informacje i publikacje nie stanowią i nie powinny być traktowane jako porady finansowe, inwestycyjne, tradingowe ani jakiekolwiek inne rekomendacje dostarczane lub zatwierdzone przez TradingView. Więcej informacji znajduje się w Warunkach użytkowania.
Tools for traders and investors smart enough to keep it simple 😘👌
➡️ SETUP SCREENER GUIDE: TheStratSuite.com/scanner/guide
🤑 TheStrat Suite is now FREE & open source: TheStratSuite.com
345strategies.com · github.com/345-strategies
➡️ SETUP SCREENER GUIDE: TheStratSuite.com/scanner/guide
🤑 TheStrat Suite is now FREE & open source: TheStratSuite.com
345strategies.com · github.com/345-strategies
Wyłączenie odpowiedzialności
Informacje i publikacje nie stanowią i nie powinny być traktowane jako porady finansowe, inwestycyjne, tradingowe ani jakiekolwiek inne rekomendacje dostarczane lub zatwierdzone przez TradingView. Więcej informacji znajduje się w Warunkach użytkowania.