Curved Trendlines (Zeiierman)
More exclusive indicators from Zeiierman
Subscribe to Zeiierman for $95.20/month to get exclusive indicators by this author. You pay right on TradingView and can use them on your charts straight away.
Explore Zeiierman█ Overview
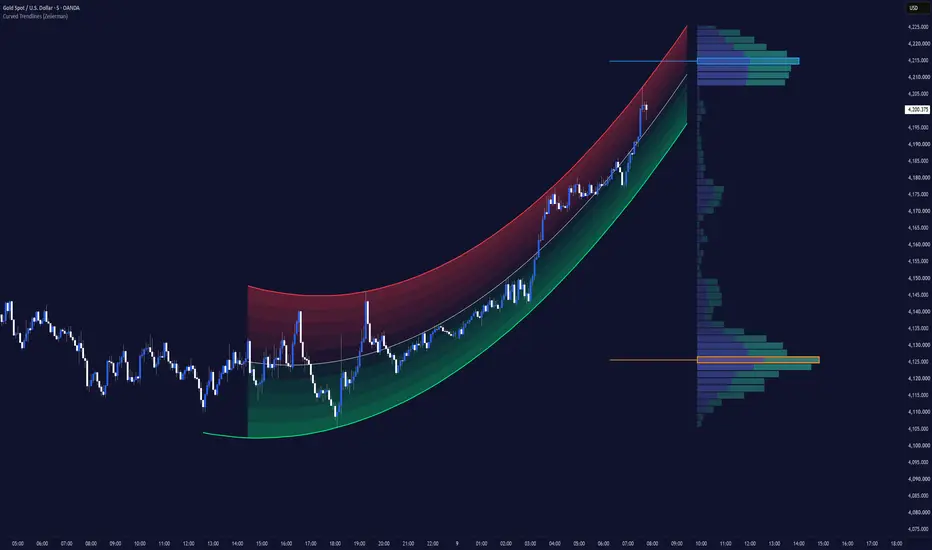
Curved Trendlines (Zeiierman) is a market-structure and volume-profile indicator that uses quadratic regression to identify curved price boundaries and historical volume distribution.
Unlike traditional trendlines that connect two points with a straight line, the indicator analyzes multiple confirmed pivot highs and lows to construct two independently fitted curves. These curves adapt to the underlying market structure, allowing the channel to capture changes in price trajectory, acceleration, and curvature.

The indicator also integrates a Live Volume Profile and Historical Memory Profiles, providing additional insight into how trading activity is distributed across the current structure and surrounding historical price areas.

⚪Assumption
The indicator is built around a simple market-structure assumption:
Price does not always move along straight structural boundaries. Its trajectory can accelerate, decelerate, or gradually change direction as market conditions evolve.
Traditional trendlines assume a constant slope between structural points. However, when price movement changes over time, a straight line may no longer represent the broader structure accurately.
By fitting quadratic curves to multiple swing points, the indicator attempts to capture these changes while maintaining boundaries around confirmed market structure.
The integrated volume profiles add another dimension by showing where historical trading activity has been concentrated, helping traders evaluate price interaction around the fitted curves.

█ How It Works
█ How to Use
⚪ Price Trajectory & Structural Boundaries
Use Curved Trendlines (Zeiierman) to identify the market’s current trajectory and visualize the most likely path price could follow if the existing structure holds.
Unlike traditional straight trendlines, the upper and lower curves adapt independently to changing market structure, providing dynamic boundaries for potential support, resistance, continuation, and breakouts.
Watch how price reacts around these boundaries. The upper curve can highlight potential rejection or bullish breakout areas, while the lower curve can indicate potential support or bearish breakdowns.
Changes in channel width and curvature can also help identify structural compression, expansion, acceleration, and deceleration.

⚪ Price Compression & Volatility Contraction
Use Curved Trendlines (Zeiierman) to identify periods of price compression and low volatility that may develop ahead of a potential breakout.
When price begins moving within tighter ranges, forming smaller candles and narrower fluctuations between the curved boundaries, it can indicate that volatility is contracting.
Watch how price reacts as compression develops:
• Tightening Price Action: Smaller candles and reduced price movement can indicate declining volatility.
• Channel Contraction: Converging upper and lower curves can highlight developing structural compression.
• Breakout Potential: A decisive break beyond either boundary, supported by increasing momentum, may signal the beginning of a larger move.
• Volume Profile Targets: Historical volume concentrations and POC levels can provide potential areas of interest following a breakout.
In this example, a break below the lower curve could open the way toward the high-volume area (POC) highlighted on the right.

⚪ Structural Breakouts & Momentum Expansion
Use Curved Trendlines (Zeiierman) to identify potential breakouts when price moves beyond the fitted upper or lower structural boundaries.
A breakout can indicate that the existing price structure is changing, potentially leading to stronger directional momentum and volatility expansion.

Watch how price behaves around the boundaries:
• Upper Curve Breakout: A decisive move above the upper boundary can signal bullish momentum and potential upside continuation.
• Lower Curve Breakout: A decisive move below the lower boundary can signal bearish momentum and potential downside continuation.
• Breakout Confirmation: Look for strong candle closes, increasing momentum, and continued price movement beyond the boundary.
• Volume Profile Context: Use the POC and surrounding volume concentrations to identify potential reaction areas and price targets.
These examples demonstrate how Gold can break above the upper curved boundary in both rising and declining structures. The direction of the curve itself does not determine the breakout direction.
Bullish Breakout Examples:


█ Settings
Structure
Historical Curves
Live Profile
Memory Profile
-----------------
Disclaimer
The content provided in my scripts, indicators, ideas, algorithms, and systems is for educational and informational purposes only. It does not constitute financial advice, investment recommendations, or a solicitation to buy or sell any financial instruments. I will not accept liability for any loss or damage, including without limitation any loss of profit, which may arise directly or indirectly from the use of or reliance on such information.
All investments involve risk, and the past performance of a security, industry, sector, market, financial product, trading strategy, backtest, or individual's trading does not guarantee future results or returns. Investors are fully responsible for any investment decisions they make. Such decisions should be based solely on an evaluation of their financial circumstances, investment objectives, risk tolerance, and liquidity needs.
Curved Trendlines (Zeiierman) is a market-structure and volume-profile indicator that uses quadratic regression to identify curved price boundaries and historical volume distribution.
Unlike traditional trendlines that connect two points with a straight line, the indicator analyzes multiple confirmed pivot highs and lows to construct two independently fitted curves. These curves adapt to the underlying market structure, allowing the channel to capture changes in price trajectory, acceleration, and curvature.
The indicator also integrates a Live Volume Profile and Historical Memory Profiles, providing additional insight into how trading activity is distributed across the current structure and surrounding historical price areas.
⚪Assumption
The indicator is built around a simple market-structure assumption:
Price does not always move along straight structural boundaries. Its trajectory can accelerate, decelerate, or gradually change direction as market conditions evolve.
Traditional trendlines assume a constant slope between structural points. However, when price movement changes over time, a straight line may no longer represent the broader structure accurately.
By fitting quadratic curves to multiple swing points, the indicator attempts to capture these changes while maintaining boundaries around confirmed market structure.
The integrated volume profiles add another dimension by showing where historical trading activity has been concentrated, helping traders evaluate price interaction around the fitted curves.
█ How It Works
⚪ 1. Structural Pivot Detection
The indicator identifies confirmed pivot highs and lows. Each side requires at least three structural points before a curve can be calculated.Pine Script®
The Structure Points setting controls how many recent pivots are included in each calculation.
⚪ 2. Quadratic Regression & Curve Fitting
The indicator applies quadratic least-squares regression independently to the upper and lower pivot structures.
Regression Formula
y = a + b·x + c·x²Pine Script®
Each curve is then shifted using its maximum or minimum regression residual, aligning the boundaries with their corresponding pivot extremes.Pine Script®
Final Curve CalculationPine Script®
This allows both boundaries to develop their own curvature rather than following a single parallel regression model.
⚪ 3. Dynamic Channel & Projection
The independently fitted curves form a channel that can expand, contract, and change direction with market structure.
The midpoint is calculated directly between both boundaries.Pine Script®
The channel is projected forward using the Extend Bars setting. Projection automatically stops before the two curves intersect.Pine Script®
⚪ 4. Live Volume Profile
The Live Volume Profile measures volume distribution from the oldest retained structure pivot to the current bar.
Each candle’s volume is divided into estimated buying and selling contributions based on its closing position.Pine Script®
Volume is then distributed proportionally across the price rows overlapped by each candle.Pine Script®
The Point of Control (POC) identifies the row containing the highest combined volume.Pine Script®
Volume direction is estimated from candle data rather than directly measured bid/ask execution.
⚪ 5. Historical Memory Profile
The Memory Profile examines historical volume outside the current structure’s traded price range.
It uses older candles to identify volume concentrations between the active price range and projected channel boundaries.Pine Script®
• Upper Memory: Historical volume above the current structure high.
• Lower Memory: Historical volume below the current structure low.
Both memory regions share the Live Profile’s price-row resolution and can display independent POCs.
⚪ 6. Historical Curves & Regression Quality
Historical channel candidates are evaluated using their R² regression fit.Pine Script®
The combined channel score uses the weaker of the two regression fits.Pine Script®
Within each historical selection window, the strongest qualifying channel is retained.Pine Script®
Historical formations are displayed using dotted boundaries. The minimum fit threshold applies only to historical channels, while the active channel always uses the latest available fitted structure.
█ How to Use
⚪ Price Trajectory & Structural Boundaries
Use Curved Trendlines (Zeiierman) to identify the market’s current trajectory and visualize the most likely path price could follow if the existing structure holds.
Unlike traditional straight trendlines, the upper and lower curves adapt independently to changing market structure, providing dynamic boundaries for potential support, resistance, continuation, and breakouts.
Watch how price reacts around these boundaries. The upper curve can highlight potential rejection or bullish breakout areas, while the lower curve can indicate potential support or bearish breakdowns.
Changes in channel width and curvature can also help identify structural compression, expansion, acceleration, and deceleration.
⚪ Price Compression & Volatility Contraction
Use Curved Trendlines (Zeiierman) to identify periods of price compression and low volatility that may develop ahead of a potential breakout.
When price begins moving within tighter ranges, forming smaller candles and narrower fluctuations between the curved boundaries, it can indicate that volatility is contracting.
Watch how price reacts as compression develops:
• Tightening Price Action: Smaller candles and reduced price movement can indicate declining volatility.
• Channel Contraction: Converging upper and lower curves can highlight developing structural compression.
• Breakout Potential: A decisive break beyond either boundary, supported by increasing momentum, may signal the beginning of a larger move.
• Volume Profile Targets: Historical volume concentrations and POC levels can provide potential areas of interest following a breakout.
In this example, a break below the lower curve could open the way toward the high-volume area (POC) highlighted on the right.
⚪ Structural Breakouts & Momentum Expansion
Use Curved Trendlines (Zeiierman) to identify potential breakouts when price moves beyond the fitted upper or lower structural boundaries.
A breakout can indicate that the existing price structure is changing, potentially leading to stronger directional momentum and volatility expansion.
Watch how price behaves around the boundaries:
• Upper Curve Breakout: A decisive move above the upper boundary can signal bullish momentum and potential upside continuation.
• Lower Curve Breakout: A decisive move below the lower boundary can signal bearish momentum and potential downside continuation.
• Breakout Confirmation: Look for strong candle closes, increasing momentum, and continued price movement beyond the boundary.
• Volume Profile Context: Use the POC and surrounding volume concentrations to identify potential reaction areas and price targets.
These examples demonstrate how Gold can break above the upper curved boundary in both rising and declining structures. The direction of the curve itself does not determine the breakout direction.
Bullish Breakout Examples:
█ Settings
Structure
- Pivot Length: Controls the left/right confirmation period used to identify structural pivot highs and lows.
- Structure Points: Determines how many recent same-side pivots are used to calculate each quadratic regression curve.
- Extend Bars: Controls how far the current fitted curves are projected into the future, subject to the curve-intersection limit.
Historical Curves
- Historical Curves: Enables previously selected structural channel formations.
- Keep: Sets the maximum number of historical channel pairs retained.
- Best Fit Window: Determines the number of bars used for each historical candidate-selection window.
- Minimum Historical Fit %: Sets the minimum combined R² score required for historical candidates.
Live Profile
- Show Live Profile: Enables the volume-at-price distribution for the current fitted structure.
- Rows: Sets the target number of price rows. Higher values provide finer price resolution.
- Width: Controls the maximum horizontal width of the profile.
- Profile Gap: Adjusts horizontal spacing between the chart projection area and the volume profiles.
- Show POC: Highlights the price row with the highest combined volume.
- Show Profile Bounds: Displays the upper and lower boundaries of the sampled live profile range.
Memory Profile
- Historical Memory Profile: Enables historical volume profiles outside the current structure's price range.
- Width: Controls the maximum horizontal width of the memory profiles.
- Show Memory POC: Highlights the highest-volume row independently within each available memory region.
-----------------
Disclaimer
The content provided in my scripts, indicators, ideas, algorithms, and systems is for educational and informational purposes only. It does not constitute financial advice, investment recommendations, or a solicitation to buy or sell any financial instruments. I will not accept liability for any loss or damage, including without limitation any loss of profit, which may arise directly or indirectly from the use of or reliance on such information.
All investments involve risk, and the past performance of a security, industry, sector, market, financial product, trading strategy, backtest, or individual's trading does not guarantee future results or returns. Investors are fully responsible for any investment decisions they make. Such decisions should be based solely on an evaluation of their financial circumstances, investment objectives, risk tolerance, and liquidity needs.

Access my indicators at: zeiierman.com
Join Our Free Discord: discord.gg/zeiiermantrading
Join Our Free Discord: discord.gg/zeiiermantrading
Wyłączenie odpowiedzialności
Informacje i publikacje nie stanowią i nie powinny być traktowane jako porady finansowe, inwestycyjne, tradingowe ani jakiekolwiek inne rekomendacje dostarczane lub zatwierdzone przez TradingView. Więcej informacji znajduje się w Warunkach użytkowania.
Access my indicators at: zeiierman.com
Join Our Free Discord: discord.gg/zeiiermantrading
Join Our Free Discord: discord.gg/zeiiermantrading
Wyłączenie odpowiedzialności
Informacje i publikacje nie stanowią i nie powinny być traktowane jako porady finansowe, inwestycyjne, tradingowe ani jakiekolwiek inne rekomendacje dostarczane lub zatwierdzone przez TradingView. Więcej informacji znajduje się w Warunkach użytkowania.