OPEN-SOURCE SCRIPT
Session VWAP + StdDev Bands [ChartPrime]
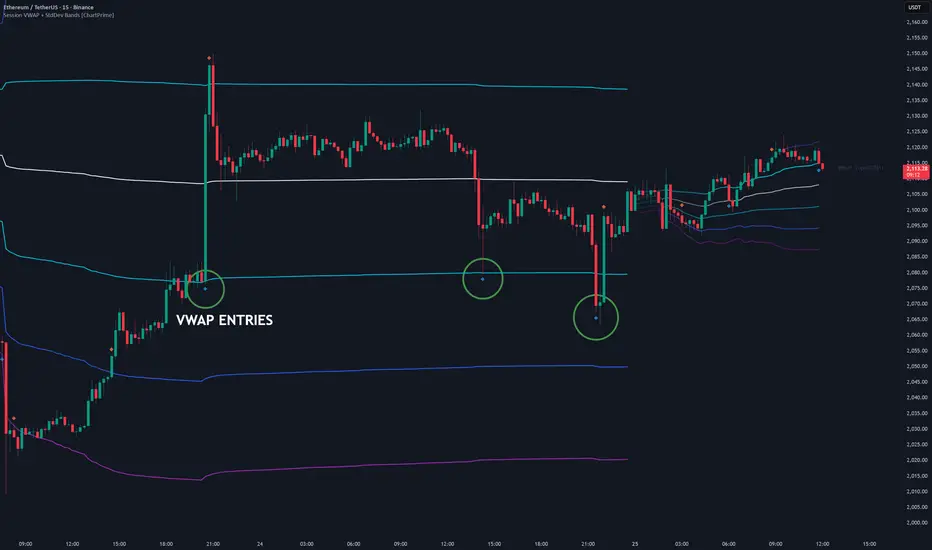
🔶 OVERVIEW
Session VWAP + StdDev Bands [ChartPrime] is a professional-grade anchored VWAP system that resets on a user-defined higher timeframe and builds a full standard deviation band structure around it. Unlike a rolling VWAP, this indicator recalculates from the first bar of each new session, giving you a clean, unbiased volume-weighted price reference that reflects exactly where the market has traded relative to volume since the session opened.
The tool goes beyond a simple VWAP line by tracking how many times price has retested each individual band, using that retest count to dynamically intensify the color of each line — the more a level is tested, the more significant it becomes visually. Cumulative volume at each retest is also tracked and displayed, giving traders institutional-grade context directly on the chart.
• Anchored VWAP with configurable higher timeframe reset (Daily, Weekly, Monthly, etc.)
• Three independent standard deviation band pairs (1σ, 2σ, 3σ)
• Per-line retest counter with dynamic color intensity — more retests = brighter line
• Cumulative volume tracking per band displayed in live edge labels
• High/Low wick-based band touch signals with cooldown control
• Clean session break with automatic label and state reset
🔶 CORE CONCEPT — ANCHORED VWAP WITH VOLUME-WEIGHTED STANDARD DEVIATION
Standard VWAP indicators use session time as the anchor. This indicator uses a higher timeframe bar close as the reset trigger, giving you full control over the session definition:
• Anchored Reset: When the selected higher timeframe (e.g. Weekly) closes a new bar, the VWAP and all standard deviation calculations reset from zero. This ensures the VWAP always reflects the current session's volume distribution.
• True StdDev Bands: Bands are calculated using a volume-weighted variance formula — not ATR, not simple standard deviation. This means the bands expand and contract based on how dispersed price has been relative to volume, not just raw price movement.
• Dynamic Color Intensity: Each of the seven lines (VWAP + 6 band lines) tracks its own retest count independently. As price crosses a line more times, its transparency decreases and the line becomes fully saturated — a visual heatmap of the most contested price levels in the session.
🔶 RETEST COUNTING & VOLUME TRACKING
The intelligence of this indicator lives in its per-line memory system:
🔶 BAND TOUCH SIGNALS
Signal shapes fire when price wicks into a band rather than waiting for a close-based cross, making them more responsive to intrabar reactions at key levels:
🔶 LIVE EDGE LABELS
Each band line carries a floating label anchored to the right edge of the chart that updates every bar:
🔶 HOW TO USE
🔶 CONCLUSION
Session VWAP + StdDev Bands [ChartPrime] turns a standard VWAP into a living, session-aware price map. By combining anchored volume-weighted calculations with per-line retest memory and cumulative volume tracking, it gives traders a clear picture of where the market has spent the most energy — and which levels are likely to matter most as the session develops.
Session VWAP + StdDev Bands [ChartPrime] is a professional-grade anchored VWAP system that resets on a user-defined higher timeframe and builds a full standard deviation band structure around it. Unlike a rolling VWAP, this indicator recalculates from the first bar of each new session, giving you a clean, unbiased volume-weighted price reference that reflects exactly where the market has traded relative to volume since the session opened.
The tool goes beyond a simple VWAP line by tracking how many times price has retested each individual band, using that retest count to dynamically intensify the color of each line — the more a level is tested, the more significant it becomes visually. Cumulative volume at each retest is also tracked and displayed, giving traders institutional-grade context directly on the chart.
• Anchored VWAP with configurable higher timeframe reset (Daily, Weekly, Monthly, etc.)
• Three independent standard deviation band pairs (1σ, 2σ, 3σ)
• Per-line retest counter with dynamic color intensity — more retests = brighter line
• Cumulative volume tracking per band displayed in live edge labels
• High/Low wick-based band touch signals with cooldown control
• Clean session break with automatic label and state reset
🔶 CORE CONCEPT — ANCHORED VWAP WITH VOLUME-WEIGHTED STANDARD DEVIATION
Standard VWAP indicators use session time as the anchor. This indicator uses a higher timeframe bar close as the reset trigger, giving you full control over the session definition:
• Anchored Reset: When the selected higher timeframe (e.g. Weekly) closes a new bar, the VWAP and all standard deviation calculations reset from zero. This ensures the VWAP always reflects the current session's volume distribution.
• True StdDev Bands: Bands are calculated using a volume-weighted variance formula — not ATR, not simple standard deviation. This means the bands expand and contract based on how dispersed price has been relative to volume, not just raw price movement.
• Dynamic Color Intensity: Each of the seven lines (VWAP + 6 band lines) tracks its own retest count independently. As price crosses a line more times, its transparency decreases and the line becomes fully saturated — a visual heatmap of the most contested price levels in the session.
🔶 RETEST COUNTING & VOLUME TRACKING
The intelligence of this indicator lives in its per-line memory system:
- Independent Counters: Every line — VWAP, 1σ Upper, 1σ Lower, 2σ Upper, 2σ Lower, 3σ Upper, 3σ Lower — has its own retest counter that increments on every close-based cross.
- Color Intensity Mapping: Each retest reduces the line's transparency by 10 points. A line with 0 retests starts at 100% transparent (invisible). After 10 retests it reaches full opacity. This creates a natural visual hierarchy where the most-tested levels stand out.
- Cumulative Volume: Every time a line is crossed, the bar's volume is added to that line's running total. The edge label displays both the retest count and the total volume that flowed through that level — e.g. "1σ↑ 4 (vol. 2.3M)".
- Session Reset: All counters, volumes, and labels reset cleanly at the start of each new session.
🔶 BAND TOUCH SIGNALS
Signal shapes fire when price wicks into a band rather than waiting for a close-based cross, making them more responsive to intrabar reactions at key levels:
- Bull Signal (Blue Diamond): The bar's low drops to or below a band line while the previous bar's low was above it — a wick touch from above, indicating potential support reaction.
- Bear Signal (Orange Diamond): The bar's high reaches or exceeds a band line while the previous bar's high was below it — a wick touch from below, indicating potential resistance reaction.
- Cooldown Filter: A configurable cooldown (default 20 bars) prevents signal clusters at the same level. Once a signal fires, the same direction cannot fire again until the cooldown expires.
🔶 LIVE EDGE LABELS
Each band line carries a floating label anchored to the right edge of the chart that updates every bar:
- Labels display the band name, retest count, and cumulative volume in a compact single-line format.
- Label text color matches the line's current dynamic color — as the line intensifies, the label text intensifies with it.
- Labels reset and reposition automatically on each new session, always staying aligned with the current band price level.
- Label size is fully configurable from Tiny to Huge to suit any screen or timeframe.
🔶 HOW TO USE
- Identifying Key Levels: Watch which bands accumulate the most retests during a session. A 1σ band with 6+ retests and high cumulative volume is a high-conviction support or resistance zone — treat it like a volume node.
- Trend Bias: Price consistently closing above VWAP signals bullish session bias. Price consistently closing below signals bearish bias. Use the VWAP retest count to gauge how contested the mean is.
- Breakout Confirmation: When price breaks through a 2σ or 3σ band with a strong close, the band color will begin to intensify on subsequent retests. A bright outer band that holds as support after a breakout is a high-probability continuation signal.
- Fading Extremes: Bear signals at 2σ or 3σ upper bands and bull signals at 2σ or 3σ lower bands are mean-reversion opportunities, especially when cumulative volume at those levels is low (few retests, thin volume).
- Timeframe Selection: Use Weekly reset on daily charts for swing trading context. Use Daily reset on intraday charts for intraday VWAP analysis. Use Monthly reset on daily or weekly charts for macro-level value area mapping.
🔶 CONCLUSION
Session VWAP + StdDev Bands [ChartPrime] turns a standard VWAP into a living, session-aware price map. By combining anchored volume-weighted calculations with per-line retest memory and cumulative volume tracking, it gives traders a clear picture of where the market has spent the most energy — and which levels are likely to matter most as the session develops.
Skrypt open-source
W zgodzie z duchem TradingView twórca tego skryptu udostępnił go jako open-source, aby użytkownicy mogli przejrzeć i zweryfikować jego działanie. Ukłony dla autora. Korzystanie jest bezpłatne, jednak ponowna publikacja kodu podlega naszym Zasadom serwisu.

Wyłączenie odpowiedzialności
Informacje i publikacje nie stanowią i nie powinny być traktowane jako porady finansowe, inwestycyjne, tradingowe ani jakiekolwiek inne rekomendacje dostarczane lub zatwierdzone przez TradingView. Więcej informacji znajduje się w Warunkach użytkowania.
Skrypt open-source
W zgodzie z duchem TradingView twórca tego skryptu udostępnił go jako open-source, aby użytkownicy mogli przejrzeć i zweryfikować jego działanie. Ukłony dla autora. Korzystanie jest bezpłatne, jednak ponowna publikacja kodu podlega naszym Zasadom serwisu.
Wyłączenie odpowiedzialności
Informacje i publikacje nie stanowią i nie powinny być traktowane jako porady finansowe, inwestycyjne, tradingowe ani jakiekolwiek inne rekomendacje dostarczane lub zatwierdzone przez TradingView. Więcej informacji znajduje się w Warunkach użytkowania.