CME Continuous Session VWAP + Standard Deviation
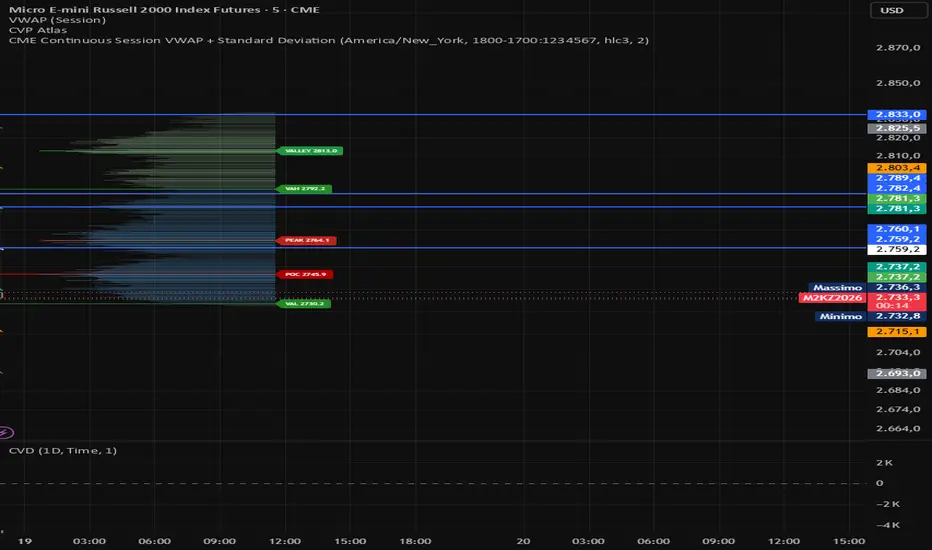
CME Continuous Session VWAP + Standard Deviation
Overview
CME Continuous Session VWAP + Standard Deviation is an intraday technical indicator designed for CME futures, including the Micro E-mini S&P 500 (MES), Micro E-mini Nasdaq-100 (MNQ), and Micro E-mini Russell 2000 (M2K).
The indicator plots a volume-weighted Volume Weighted Average Price (VWAP) together with cumulative, volume-weighted standard deviation bands. It is designed to help traders assess the relationship between price and the session's volume-weighted average, identify deviations from that average, and observe how price dispersion evolves throughout the futures trading day.
Calculation Method
The VWAP is calculated using the selected price source and the volume of each eligible bar. The standard deviation is calculated from the same price observations and volume weights used for the VWAP.
The indicator displays three configurable levels above and below the VWAP:
±1σ: One standard deviation from the VWAP.
±2σ: Two standard deviations from the VWAP.
±3σ: Three standard deviations from the VWAP.
The standard deviation is cumulative within the selected trading session and is weighted by volume. It is not based on ATR, a rolling window, or an estimate of future volatility. The bands describe the weighted dispersion of observed bar prices around the VWAP; they do not guarantee price reversals or statistically defined probabilities of containment.
Session and Reset Behavior
The default session is configured for the CME futures trading day, from 6:00 PM to 5:00 PM Eastern Time (ET).
The VWAP and standard deviation calculations reset at the beginning of each new futures trading day. Overnight trading and the regular US session (RTH) are included in the same calculation, so the indicator does not reset at the 9:30 AM ET regular-session open.
During scheduled breaks or periods outside the configured session, no new observations are added. The indicator does not plot values outside the selected session. When trading resumes within the same trading day, calculations continue from the existing cumulative totals.
The session hours and time zone can be configured in the indicator settings. Actual results depend on the chart's available market data and the selected symbol's trading-session configuration.
Settings and Customization
Session
Exchange Time Zone: Sets the time zone used to interpret session hours. The default is America/New_York, which automatically accounts for US daylight saving time.
Futures Trading Session: Defines the session window used for calculations. The default is 1800-1700, covering the overnight and regular trading periods.
Calculation
Price Source: Selects the price series used in both the VWAP and standard deviation calculations. The default is HLC3, calculated as (High + Low + Close) / 3.
Standard Deviation Bands
Show ±1σ: Displays or hides the first upper and lower deviation bands.
Show ±2σ: Displays or hides the second upper and lower deviation bands.
Show ±3σ: Displays or hides the third upper and lower deviation bands.
Style
VWAP Color: Changes the VWAP line color.
±1σ Color: Changes the color of the first deviation pair.
±2σ Color: Changes the color of the second deviation pair.
±3σ Color: Changes the color of the third deviation pair.
VWAP Width: Adjusts the VWAP line thickness.
Intended Use
The indicator can be used to monitor intraday price dispersion, evaluate the position of price relative to the volume-weighted average, and provide context for discretionary trading decisions. It can be combined with volume analysis, market structure, order-flow tools, and support/resistance levels.
The bands should not be interpreted as standalone entry or exit signals. Their usefulness depends on the instrument, market conditions, session definition, and the trader's broader methodology.
Limitations
This indicator uses bar-level prices and volume rather than individual trade-level data. Its standard deviation therefore measures the dispersion of the selected bar-price observations, not the full distribution of individual transactions.
Results may differ from other VWAP indicators because of differences in session boundaries, price sources, volume handling, anchoring, or standard deviation methodology
Overview
CME Continuous Session VWAP + Standard Deviation is an intraday technical indicator designed for CME futures, including the Micro E-mini S&P 500 (MES), Micro E-mini Nasdaq-100 (MNQ), and Micro E-mini Russell 2000 (M2K).
The indicator plots a volume-weighted Volume Weighted Average Price (VWAP) together with cumulative, volume-weighted standard deviation bands. It is designed to help traders assess the relationship between price and the session's volume-weighted average, identify deviations from that average, and observe how price dispersion evolves throughout the futures trading day.
Calculation Method
The VWAP is calculated using the selected price source and the volume of each eligible bar. The standard deviation is calculated from the same price observations and volume weights used for the VWAP.
The indicator displays three configurable levels above and below the VWAP:
±1σ: One standard deviation from the VWAP.
±2σ: Two standard deviations from the VWAP.
±3σ: Three standard deviations from the VWAP.
The standard deviation is cumulative within the selected trading session and is weighted by volume. It is not based on ATR, a rolling window, or an estimate of future volatility. The bands describe the weighted dispersion of observed bar prices around the VWAP; they do not guarantee price reversals or statistically defined probabilities of containment.
Session and Reset Behavior
The default session is configured for the CME futures trading day, from 6:00 PM to 5:00 PM Eastern Time (ET).
The VWAP and standard deviation calculations reset at the beginning of each new futures trading day. Overnight trading and the regular US session (RTH) are included in the same calculation, so the indicator does not reset at the 9:30 AM ET regular-session open.
During scheduled breaks or periods outside the configured session, no new observations are added. The indicator does not plot values outside the selected session. When trading resumes within the same trading day, calculations continue from the existing cumulative totals.
The session hours and time zone can be configured in the indicator settings. Actual results depend on the chart's available market data and the selected symbol's trading-session configuration.
Settings and Customization
Session
Exchange Time Zone: Sets the time zone used to interpret session hours. The default is America/New_York, which automatically accounts for US daylight saving time.
Futures Trading Session: Defines the session window used for calculations. The default is 1800-1700, covering the overnight and regular trading periods.
Calculation
Price Source: Selects the price series used in both the VWAP and standard deviation calculations. The default is HLC3, calculated as (High + Low + Close) / 3.
Standard Deviation Bands
Show ±1σ: Displays or hides the first upper and lower deviation bands.
Show ±2σ: Displays or hides the second upper and lower deviation bands.
Show ±3σ: Displays or hides the third upper and lower deviation bands.
Style
VWAP Color: Changes the VWAP line color.
±1σ Color: Changes the color of the first deviation pair.
±2σ Color: Changes the color of the second deviation pair.
±3σ Color: Changes the color of the third deviation pair.
VWAP Width: Adjusts the VWAP line thickness.
Intended Use
The indicator can be used to monitor intraday price dispersion, evaluate the position of price relative to the volume-weighted average, and provide context for discretionary trading decisions. It can be combined with volume analysis, market structure, order-flow tools, and support/resistance levels.
The bands should not be interpreted as standalone entry or exit signals. Their usefulness depends on the instrument, market conditions, session definition, and the trader's broader methodology.
Limitations
This indicator uses bar-level prices and volume rather than individual trade-level data. Its standard deviation therefore measures the dispersion of the selected bar-price observations, not the full distribution of individual transactions.
Results may differ from other VWAP indicators because of differences in session boundaries, price sources, volume handling, anchoring, or standard deviation methodology

Wyłączenie odpowiedzialności
Informacje i publikacje nie stanowią i nie powinny być traktowane jako porady finansowe, inwestycyjne, tradingowe ani jakiekolwiek inne rekomendacje dostarczane lub zatwierdzone przez TradingView. Więcej informacji znajduje się w Warunkach użytkowania.
Wyłączenie odpowiedzialności
Informacje i publikacje nie stanowią i nie powinny być traktowane jako porady finansowe, inwestycyjne, tradingowe ani jakiekolwiek inne rekomendacje dostarczane lub zatwierdzone przez TradingView. Więcej informacji znajduje się w Warunkach użytkowania.