OPEN-SOURCE SCRIPT
Zaktualizowano True Trend Oscillator + Price Envelope
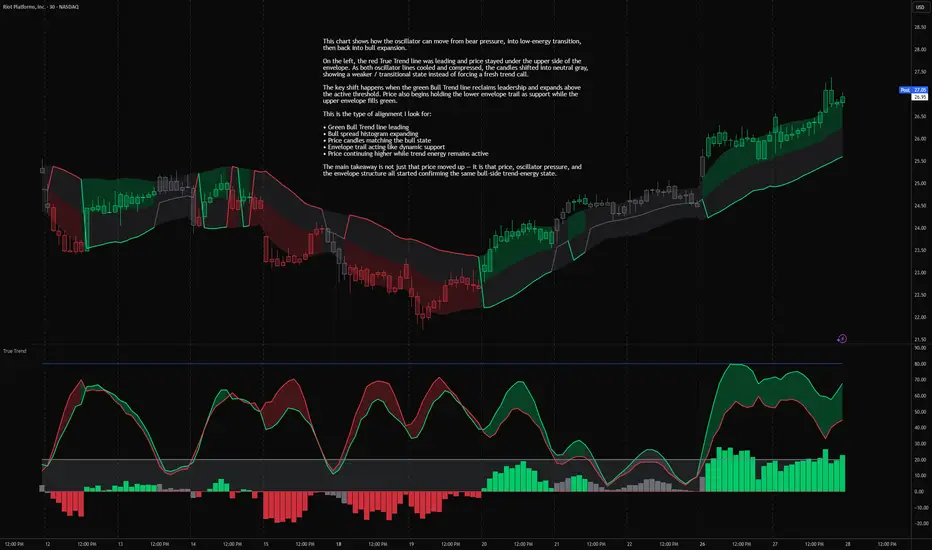
True Trend Oscillator + Price Envelope is a Pine v6 rebuild and expanded interpretation of the original True Trend Oscillator concept by wbburgin.
The original idea is simple but powerful:
• Convert ATR into a stochastic volatility / trend-energy reading
• Smooth that Stoch ATR reading with a Rational Quadratic Kernel
• Use RSI as the directional pressure input
• Build separate Bull Trend and Bear Trend lines from that shared volatility engine
In this rebuild, I kept the original spirit of the oscillator but expanded it into a fuller trend-energy framework with automatic timeframe-aware settings, cleaner visual controls, price-pane candles, and a chart-side ATR envelope.
────────────────────────────
Core Idea
────────────────────────────
The oscillator is built from two main pieces:
1. Volatility / trend energy
ATR is normalized through a stochastic calculation, then smoothed with a Rational Quadratic Kernel. This creates the “energy” side of the oscillator.
2. Directional pressure
RSI supplies the directional side of the model.
The two final oscillator lines are:
Bull Trend = sqrt(RSI × Smoothed Stoch ATR)
Bear Trend = sqrt((100 - RSI) × Smoothed Stoch ATR)
That means the Bull and Bear lines are both connected to the same volatility / trend-energy source, but RSI determines which side has more directional pressure.
────────────────────────────
How to Read the Oscillator
────────────────────────────
The oscillator has two main lines:
• Bull Trend line
• Bear Trend line
The leading line shows which side currently has control.
A few practical reads:
• Bull above Bear
Bull pressure is leading.
• Bear above Bull
Bear pressure is leading.
• Both lines rising together
Trend energy is expanding.
• Both lines falling together
Trend energy is cooling, compressing, or losing force.
• Both lines collapsing near zero
The market is moving into a low-energy / compression state.
This is one of the more important parts of the script. The oscillator is not only asking which side is leading but whether the move has enough volatility energy behind it to matter.
────────────────────────────
Active Trend Threshold
────────────────────────────
The active threshold is used to separate trend conditions from low-energy / range conditions.
A trend is only treated as active when the weaker side of the oscillator is above the active threshold.
In plain terms:
• Bull can be above Bear, but if both lines are too weak, the script treats the market as range / low energy.
• Bear can be above Bull, but if volatility energy is collapsing, the script does not force a strong trend read.
• When both sides clear the threshold, the leading side becomes more meaningful.
This helps reduce the “every crossover is a signal” problem that many simple oscillators can have.
────────────────────────────
Extreme Readings
────────────────────────────
The script includes an upper guide at 80. When the Bull Trend line pushes above 80, the script can highlight that as an extreme bull-energy condition. When the Bear Trend line pushes above 80, the script can highlight that as an extreme bear-energy condition.
By default:
• Bull extreme = orange
• Bear extreme = purple
These colors can also carry into the price candles and envelope visuals, making strong directional energy easier to spot without needing to stare only at the oscillator pane.
────────────────────────────
Auto / Manual Engine
────────────────────────────
The script includes an Auto / Manual engine profile.
Auto mode adjusts the main calculation settings based on the chart timeframe, including:
• ATR length
• Stochastic length
• RSI length
• Stoch smoothing
• Kernel lookback
• Kernel weighting
• Active range threshold
Manual mode unlocks the user-defined settings. When Auto mode is active, the manual inputs are grayed out so the settings panel stays easier to understand.
────────────────────────────
Price Candle Overlay
────────────────────────────
This rebuild includes a price-pane candle overlay using plotcandle() and force_overlay.
The candle overlay keeps the real OHLC candle shape intact, but recolors the body, wick, and border based on the active True Trend state.
The candle colors can represent:
• Bull trend
• Bear trend
• Range / low-energy
• Bull extreme
• Bear extreme
Body, wick, and border transparency are controlled separately, so the candle overlay can be made bold or subtle depending on the chart style.
────────────────────────────
True Trend Price Envelope
────────────────────────────
The script also includes a True Trend Price Envelope projected onto the main chart.
The envelope is built from:
• EMA(HLC3) basis
• ATR-based width
• True Trend strength expansion
As oscillator strength increases, the envelope can widen. This creates a chart-side visual map of how the oscillator’s trend-energy state is interacting with price.
The envelope behavior is designed around support / resistance style context:
• Bull-side pressure fills the upper half of the envelope
• Bear-side pressure fills the lower half of the envelope
• Bull pressure can plot the lower band as a support-style trail
• Bear pressure can plot the upper band as a resistance-style trail
• Neutral conditions can optionally show a soft neutral envelope or basis trail
This helps connect the oscillator pane back to price instead of leaving the oscillator isolated below the chart.
────────────────────────────
How I Use It
────────────────────────────
I use this script as a trend-energy and compression map.
A few practical ways to read it:
• When Bull is above Bear and both lines are rising, bull pressure is expanding with energy.
• When Bear is above Bull and both lines are rising, bear pressure is expanding with energy.
• When the leading side is still on top but both lines are falling, the move may be cooling or losing force.
• When both lines collapse toward zero, the market may be compressing or moving through a lower-energy phase.
• When price is holding the envelope trail in the same direction as the oscillator state, the price chart is confirming the oscillator pressure more cleanly.
• When oscillator pressure and price-envelope behavior disagree, that disagreement can be useful information by itself because it may point to chop, transition, or fading momentum.
• Extreme colors can help identify when directional energy is stretched rather than simply trending.
This is not meant to be a standalone buy/sell signal machine. It is a visual context tool designed to help organize trend direction, volatility energy, compression, and price confirmation.
────────────────────────────
Attribution
────────────────────────────
This script is a Pine v6 rebuild and expanded interpretation of the original True Trend Oscillator concept by wbburgin.
Original author / concept:
• © wbburgin
• Original TradingView script:
tradingview.com/v/R3T9epUR/
This version adds my own Pine v6 structure, Auto / Manual timeframe behavior, expanded visuals, price-pane plotcandles, extreme-state coloring, and the True Trend Price Envelope.
Special thanks to jdehorty for the KernelFunctions library used for the Rational Quadratic Kernel smoothing.
As always, this script is a visual context tool. It is not financial advice and is not meant to replace risk management, market structure, support/resistance, volume analysis, or a complete trading plan.
────────────────────────────
Chart Examples
────────────────────────────


The original idea is simple but powerful:
• Convert ATR into a stochastic volatility / trend-energy reading
• Smooth that Stoch ATR reading with a Rational Quadratic Kernel
• Use RSI as the directional pressure input
• Build separate Bull Trend and Bear Trend lines from that shared volatility engine
In this rebuild, I kept the original spirit of the oscillator but expanded it into a fuller trend-energy framework with automatic timeframe-aware settings, cleaner visual controls, price-pane candles, and a chart-side ATR envelope.
────────────────────────────
Core Idea
────────────────────────────
The oscillator is built from two main pieces:
1. Volatility / trend energy
ATR is normalized through a stochastic calculation, then smoothed with a Rational Quadratic Kernel. This creates the “energy” side of the oscillator.
2. Directional pressure
RSI supplies the directional side of the model.
The two final oscillator lines are:
Bull Trend = sqrt(RSI × Smoothed Stoch ATR)
Bear Trend = sqrt((100 - RSI) × Smoothed Stoch ATR)
That means the Bull and Bear lines are both connected to the same volatility / trend-energy source, but RSI determines which side has more directional pressure.
────────────────────────────
How to Read the Oscillator
────────────────────────────
The oscillator has two main lines:
• Bull Trend line
• Bear Trend line
The leading line shows which side currently has control.
A few practical reads:
• Bull above Bear
Bull pressure is leading.
• Bear above Bull
Bear pressure is leading.
• Both lines rising together
Trend energy is expanding.
• Both lines falling together
Trend energy is cooling, compressing, or losing force.
• Both lines collapsing near zero
The market is moving into a low-energy / compression state.
This is one of the more important parts of the script. The oscillator is not only asking which side is leading but whether the move has enough volatility energy behind it to matter.
────────────────────────────
Active Trend Threshold
────────────────────────────
The active threshold is used to separate trend conditions from low-energy / range conditions.
A trend is only treated as active when the weaker side of the oscillator is above the active threshold.
In plain terms:
• Bull can be above Bear, but if both lines are too weak, the script treats the market as range / low energy.
• Bear can be above Bull, but if volatility energy is collapsing, the script does not force a strong trend read.
• When both sides clear the threshold, the leading side becomes more meaningful.
This helps reduce the “every crossover is a signal” problem that many simple oscillators can have.
────────────────────────────
Extreme Readings
────────────────────────────
The script includes an upper guide at 80. When the Bull Trend line pushes above 80, the script can highlight that as an extreme bull-energy condition. When the Bear Trend line pushes above 80, the script can highlight that as an extreme bear-energy condition.
By default:
• Bull extreme = orange
• Bear extreme = purple
These colors can also carry into the price candles and envelope visuals, making strong directional energy easier to spot without needing to stare only at the oscillator pane.
────────────────────────────
Auto / Manual Engine
────────────────────────────
The script includes an Auto / Manual engine profile.
Auto mode adjusts the main calculation settings based on the chart timeframe, including:
• ATR length
• Stochastic length
• RSI length
• Stoch smoothing
• Kernel lookback
• Kernel weighting
• Active range threshold
Manual mode unlocks the user-defined settings. When Auto mode is active, the manual inputs are grayed out so the settings panel stays easier to understand.
────────────────────────────
Price Candle Overlay
────────────────────────────
This rebuild includes a price-pane candle overlay using plotcandle() and force_overlay.
The candle overlay keeps the real OHLC candle shape intact, but recolors the body, wick, and border based on the active True Trend state.
The candle colors can represent:
• Bull trend
• Bear trend
• Range / low-energy
• Bull extreme
• Bear extreme
Body, wick, and border transparency are controlled separately, so the candle overlay can be made bold or subtle depending on the chart style.
────────────────────────────
True Trend Price Envelope
────────────────────────────
The script also includes a True Trend Price Envelope projected onto the main chart.
The envelope is built from:
• EMA(HLC3) basis
• ATR-based width
• True Trend strength expansion
As oscillator strength increases, the envelope can widen. This creates a chart-side visual map of how the oscillator’s trend-energy state is interacting with price.
The envelope behavior is designed around support / resistance style context:
• Bull-side pressure fills the upper half of the envelope
• Bear-side pressure fills the lower half of the envelope
• Bull pressure can plot the lower band as a support-style trail
• Bear pressure can plot the upper band as a resistance-style trail
• Neutral conditions can optionally show a soft neutral envelope or basis trail
This helps connect the oscillator pane back to price instead of leaving the oscillator isolated below the chart.
────────────────────────────
How I Use It
────────────────────────────
I use this script as a trend-energy and compression map.
A few practical ways to read it:
• When Bull is above Bear and both lines are rising, bull pressure is expanding with energy.
• When Bear is above Bull and both lines are rising, bear pressure is expanding with energy.
• When the leading side is still on top but both lines are falling, the move may be cooling or losing force.
• When both lines collapse toward zero, the market may be compressing or moving through a lower-energy phase.
• When price is holding the envelope trail in the same direction as the oscillator state, the price chart is confirming the oscillator pressure more cleanly.
• When oscillator pressure and price-envelope behavior disagree, that disagreement can be useful information by itself because it may point to chop, transition, or fading momentum.
• Extreme colors can help identify when directional energy is stretched rather than simply trending.
This is not meant to be a standalone buy/sell signal machine. It is a visual context tool designed to help organize trend direction, volatility energy, compression, and price confirmation.
────────────────────────────
Attribution
────────────────────────────
This script is a Pine v6 rebuild and expanded interpretation of the original True Trend Oscillator concept by wbburgin.
Original author / concept:
• © wbburgin
• Original TradingView script:
tradingview.com/v/R3T9epUR/
This version adds my own Pine v6 structure, Auto / Manual timeframe behavior, expanded visuals, price-pane plotcandles, extreme-state coloring, and the True Trend Price Envelope.
Special thanks to jdehorty for the KernelFunctions library used for the Rational Quadratic Kernel smoothing.
As always, this script is a visual context tool. It is not financial advice and is not meant to replace risk management, market structure, support/resistance, volume analysis, or a complete trading plan.
────────────────────────────
Chart Examples
────────────────────────────
Informacje o Wersji
────────────────────────────Update Notes
────────────────────────────
This update keeps the original True Trend Oscillator + Price Envelope concept intact, but expands the script into a more complete trend-energy dashboard.
What changed in this update:
• Added a stabilized higher-timeframe True Trend reference line
- The HTF line plots the dominant higher-timeframe side
- If HTF Bull Trend is leading, the line plots HTF Bull Trend
- If HTF Bear Trend is leading, the line plots HTF Bear Trend
- The line stays on the same 0–100 scale as the main oscillator
- HTF sampling supports Live HTF Float and Confirmed HTF Close behavior
• Added a compact True Trend information table
- Shows the current True Trend state
- Shows active RSI value with its SMA reference
- Shows active Stoch ATR value with its SMA reference
- Shows Bull Plot, Bear Plot, and Spread values
- Shows delta changes compared to the selected number of bars back
- Table row tooltips explain what each metric represents and how the delta coloring works
• Improved Auto-mode transparency
- The table now labels the active RSI length, such as RSI 10, RSI 14, RSI 18, or RSI 21
- The Stoch ATR row now labels the active ATR / Stochastic length pair
- This makes it clearer that Auto mode adjusts RSI and Stoch ATR settings by chart timeframe
• Improved oscillator plot coloring
- The Bull and Bear plots now share the active state color
- Green = Bull Trend
- Red = Bear Trend
- Gray = Range / Low Energy
- Orange = Bull Extreme
- Purple = Bear Extreme
- The oscillator fill remains separate, so users can still see the space between the two plots while the plot pair reflects the current regime
• Improved table formatting
- RSI and Stoch ATR SMA references are shown in parentheses beside the main value
- Delta values are separated into the right column and colored by change
- Header text contrast was improved for bull-state readability
• Improved tooltips and internal documentation
- Kernel smoothing is explained more clearly
- Auto-mode behavior is explained more clearly
- RSI and Stoch ATR timeframe-aware behavior is documented
- HTF reference behavior is documented
- Table rows now include hover tooltips for easier interpretation
Overall, this update is focused on clarity, higher-timeframe context, and making the script easier to read at a glance.
────────────────────────────
Chart Examples
────────────────────────────
Skrypt open-source
W zgodzie z duchem TradingView twórca tego skryptu udostępnił go jako open-source, aby użytkownicy mogli przejrzeć i zweryfikować jego działanie. Ukłony dla autora. Korzystanie jest bezpłatne, jednak ponowna publikacja kodu podlega naszym Zasadom serwisu.

🆓 Free scripts:
⚡ Pro scripts: tradingview.com/script/hESCvPuH-Predictive-Volume-MTF-Pro/
🙋♂️ Get help with Pinescript: simplecrypto.life/get-help-with-pinescript
⚡ Pro scripts: tradingview.com/script/hESCvPuH-Predictive-Volume-MTF-Pro/
🙋♂️ Get help with Pinescript: simplecrypto.life/get-help-with-pinescript
Wyłączenie odpowiedzialności
Informacje i publikacje nie stanowią i nie powinny być traktowane jako porady finansowe, inwestycyjne, tradingowe ani jakiekolwiek inne rekomendacje dostarczane lub zatwierdzone przez TradingView. Więcej informacji znajduje się w Warunkach użytkowania.
Skrypt open-source
W zgodzie z duchem TradingView twórca tego skryptu udostępnił go jako open-source, aby użytkownicy mogli przejrzeć i zweryfikować jego działanie. Ukłony dla autora. Korzystanie jest bezpłatne, jednak ponowna publikacja kodu podlega naszym Zasadom serwisu.
🆓 Free scripts:
⚡ Pro scripts: tradingview.com/script/hESCvPuH-Predictive-Volume-MTF-Pro/
🙋♂️ Get help with Pinescript: simplecrypto.life/get-help-with-pinescript
⚡ Pro scripts: tradingview.com/script/hESCvPuH-Predictive-Volume-MTF-Pro/
🙋♂️ Get help with Pinescript: simplecrypto.life/get-help-with-pinescript
Wyłączenie odpowiedzialności
Informacje i publikacje nie stanowią i nie powinny być traktowane jako porady finansowe, inwestycyjne, tradingowe ani jakiekolwiek inne rekomendacje dostarczane lub zatwierdzone przez TradingView. Więcej informacji znajduje się w Warunkach użytkowania.