OPEN-SOURCE SCRIPT
Zaktualizowano Dikshant Liquidity Voids & Market Imbalances
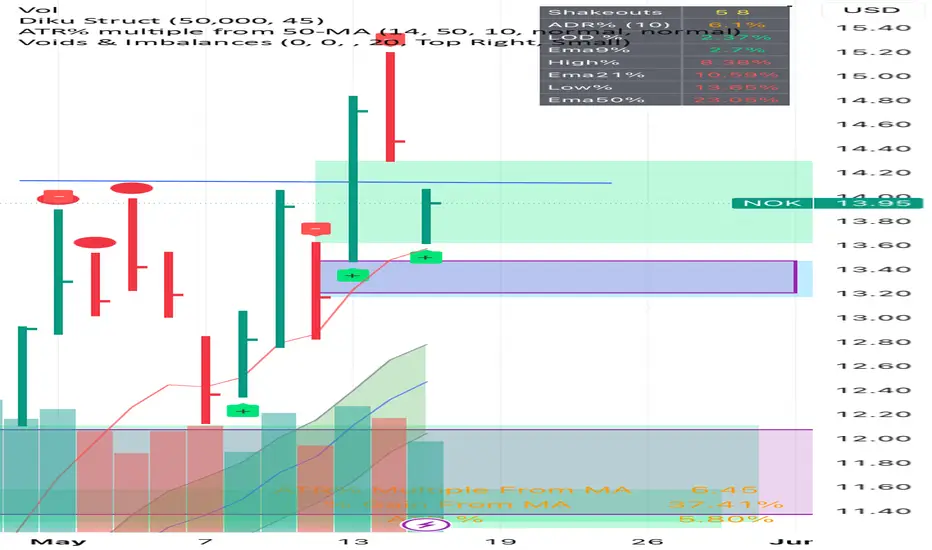
In modern market micro-structure, price moves through alternating phases of balance and imbalance. This open-source script is a highly optimized, dual-engine technical tool designed to identify, map, and track institutional liquidity anomalies in real time.
By calculating structural inefficiencies like Fair Value Gaps (FVG) and Value Gaps (2-bar closing anomalies), this indicator highlights hidden support and resistance zones where institutional algorithms are likely to re-engage with the market.
Whether you trade ICT, SMC, or pure price action, this script acts as a lens for viewing market inefficiency and order flow mitigation.
Core Features
🚀 Dual Architecture Detection: Simultaneously tracks 3-bar Fair Value Gaps (FVGs) and 2-bar Closing Value Gaps across historical data.
📊 Live Terminal Dashboard: An elegant, real-time analytics grid summarizing structural metrics, total count of imbalances, and the statistical percentage of zone mitigation.
🔄 Adaptive Volatility Filter: Toggle on adaptive sizing to calculate a dynamic threshold based on cumulative historical volatility, filtering out market noise during low-liquidity sessions.
💡 Fluid Profiling vs. Static Boundaries: Choose between static historical zones (drawn via boxes) or fluid, real-time price profiles that shift dynamically as price tests the imbalance boundaries.
🎯 Breach Tracking Engine: Automatically drops a secondary dashed level precisely at the coordinate where an imbalance zone was invalidated or mitigated.
How It Works (The Logic)
The indicator breaks down market imbalances into two major structures:
1. Structural Imbalances (Fair Value Gaps)
Occurs across a 3-bar sequence where a rapid expansion leaves a market vacuum.
Bullish Imbalance: The low of Bar 3 is entirely higher than the high of Bar 1.
Bearish Imbalance: The high of Bar 3 is entirely lower than the low of Bar 1.
2. Structural Value Gaps
Occurs when a gap opens up between the close of the previous candle and the extremum of the current candle, independent of a 3-bar sequence.
Bullish Value Gap: The current bar's low is completely above the prior bar's close.
Bearish Value Gap: The current bar's high is completely below the prior bar's close.
User Inputs & Adjustments
Spread Threshold %: Set a minimum percentage size relative to price for a gap to be drawn. Perfect for filtering out tiny, insignificant gaps.
Analysis Horizon (Timeframe): Allows you to anchor multi-timeframe analysis (MTF) onto your current chart seamlessly.
Max Active Lines Shown: Limits the structural display to only show the most recent N unmitigated levels, keeping your charts exceptionally clean.
Trading Applications & Practical Examples
Example 1: Institutional Re-entry (Order Block / FVG Confluence)
Scenario: Price aggressively breaks market structure to the upside, leaving behind a thick Long Sentiment Zone (Bullish FVG).
Execution: Instead of chasing the breakout, wait for a mean-reversion pullback. Place a limit order near the upper boundary of the highlighted box. Use the lower boundary of the zone as an invalidation reference for structural risk management (stop loss).
Example 2: Trapped Liquidity & Zone Breach
Scenario: A Short Sentiment Zone (Bearish FVG) forms during a markdown phase. However, price returns and completely aggressively closes above the upper boundary.
Execution: The dashboard will log this as a "Mitigated" event, and if enabled, a dashed Breach Line will be drawn. This acts as a clear signal that order flow has shifted from bearish to bullish, turning a failed resistance into a fresh propulsion zone.
Example 3: Scalping with Multi-Timeframe Horizons
Scenario: You are executing intraday scalps on a 1-Minute chart.
Execution: Change the Analysis Horizon input to 5m or 15m. The script will project higher-timeframe algorithmic imbalances right onto your execution chart, keeping you aligned with macro institutional flow.
Disclaimer
Imbalances represent areas where price moved too quickly for the market to facilitate balanced trade. While they are highly reliable magnets for price action, they should always be coupled with volume profiling, trend structures, or mechanical confirmations. Always practice proper risk mitigation.
Informacje o Wersji
OverviewIn modern market micro-structure, price moves through alternating phases of balance and imbalance. This open-source script is a highly optimized, dual-engine technical tool designed to identify, map, and track institutional liquidity anomalies in real time.
By calculating structural inefficiencies like Fair Value Gaps (FVG) and Value Gaps (2-bar closing anomalies), this indicator highlights hidden support and resistance zones where institutional algorithms are likely to re-engage with the market.
Whether you trade ICT, SMC, or pure price action, this script acts as a lens for viewing market inefficiency and order flow mitigation.
Core Features
🚀 Dual Architecture Detection: Simultaneously tracks 3-bar Fair Value Gaps (FVGs) and 2-bar Closing Value Gaps across historical data.
📊 Live Terminal Dashboard: An elegant, real-time analytics grid summarizing structural metrics, total count of imbalances, and the statistical percentage of zone mitigation.
🔄 Adaptive Volatility Filter: Toggle on adaptive sizing to calculate a dynamic threshold based on cumulative historical volatility, filtering out market noise during low-liquidity sessions.
💡 Fluid Profiling vs. Static Boundaries: Choose between static historical zones (drawn via boxes) or fluid, real-time price profiles that shift dynamically as price tests the imbalance boundaries.
🎯 Breach Tracking Engine: Automatically drops a secondary dashed level precisely at the coordinate where an imbalance zone was invalidated or mitigated.
How It Works (The Logic)
The indicator breaks down market imbalances into two major structures:
1. Structural Imbalances (Fair Value Gaps)
Occurs across a 3-bar sequence where a rapid expansion leaves a market vacuum.
Bullish Imbalance: The low of Bar 3 is entirely higher than the high of Bar 1.
Bearish Imbalance: The high of Bar 3 is entirely lower than the low of Bar 1.
2. Structural Value Gaps
Occurs when a gap opens up between the close of the previous candle and the extremum of the current candle, independent of a 3-bar sequence.
Bullish Value Gap: The current bar's low is completely above the prior bar's close.
Bearish Value Gap: The current bar's high is completely below the prior bar's close.
User Inputs & Adjustments
Spread Threshold %: Set a minimum percentage size relative to price for a gap to be drawn. Perfect for filtering out tiny, insignificant gaps.
Analysis Horizon (Timeframe): Allows you to anchor multi-timeframe analysis (MTF) onto your current chart seamlessly.
Max Active Lines Shown: Limits the structural display to only show the most recent N unmitigated levels, keeping your charts exceptionally clean.
Trading Applications & Practical Examples
Example 1: Institutional Re-entry (Order Block / FVG Confluence)
Scenario: Price aggressively breaks market structure to the upside, leaving behind a thick Long Sentiment Zone (Bullish FVG).
Execution: Instead of chasing the breakout, wait for a mean-reversion pullback. Place a limit order near the upper boundary of the highlighted box. Use the lower boundary of the zone as an invalidation reference for structural risk management (stop loss).
Example 2: Trapped Liquidity & Zone Breach
Scenario: A Short Sentiment Zone (Bearish FVG) forms during a markdown phase. However, price returns and completely aggressively closes above the upper boundary.
Execution: The dashboard will log this as a "Mitigated" event, and if enabled, a dashed Breach Line will be drawn. This acts as a clear signal that order flow has shifted from bearish to bullish, turning a failed resistance into a fresh propulsion zone.
Example 3: Scalping with Multi-Timeframe Horizons
Scenario: You are executing intraday scalps on a 1-Minute chart.
Execution: Change the Analysis Horizon input to 5m or 15m. The script will project higher-timeframe algorithmic imbalances right onto your execution chart, keeping you aligned with macro institutional flow.
Disclaimer
Imbalances represent areas where price moved too quickly for the market to facilitate balanced trade. While they are highly reliable magnets for price action, they should always be coupled with volume profiling, trend structures, or mechanical confirmations. Always practice proper risk mitigation.
Skrypt open-source
W zgodzie z duchem TradingView twórca tego skryptu udostępnił go jako open-source, aby użytkownicy mogli przejrzeć i zweryfikować jego działanie. Ukłony dla autora. Korzystanie jest bezpłatne, jednak ponowna publikacja kodu podlega naszym Zasadom serwisu.

Wyłączenie odpowiedzialności
Informacje i publikacje nie stanowią i nie powinny być traktowane jako porady finansowe, inwestycyjne, tradingowe ani jakiekolwiek inne rekomendacje dostarczane lub zatwierdzone przez TradingView. Więcej informacji znajduje się w Warunkach użytkowania.
Skrypt open-source
W zgodzie z duchem TradingView twórca tego skryptu udostępnił go jako open-source, aby użytkownicy mogli przejrzeć i zweryfikować jego działanie. Ukłony dla autora. Korzystanie jest bezpłatne, jednak ponowna publikacja kodu podlega naszym Zasadom serwisu.
Wyłączenie odpowiedzialności
Informacje i publikacje nie stanowią i nie powinny być traktowane jako porady finansowe, inwestycyjne, tradingowe ani jakiekolwiek inne rekomendacje dostarczane lub zatwierdzone przez TradingView. Więcej informacji znajduje się w Warunkach użytkowania.