Zaktualizowano
(CM|DB) Caruso Market Dashboard
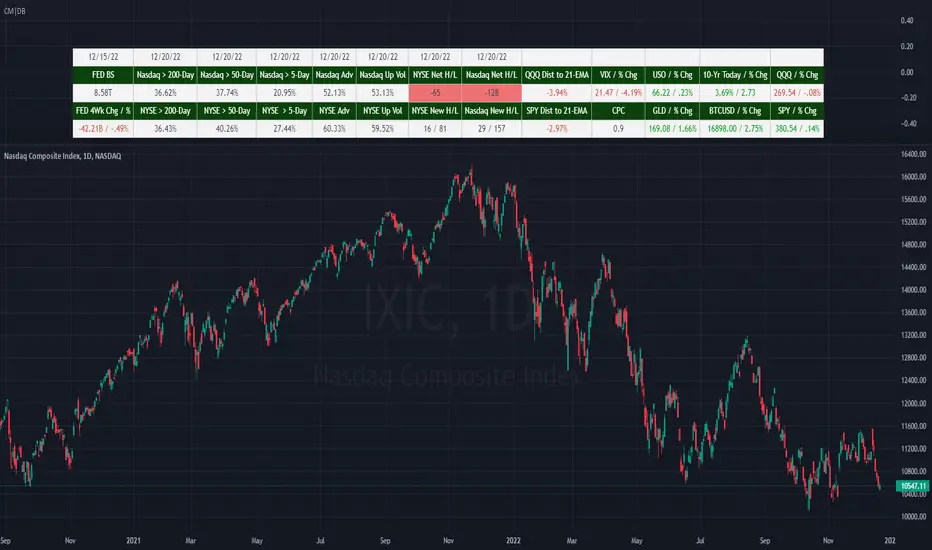
The Caruso Market Dashboard (CM|DB) provides a snapshot of key US market data, market internals (breadth), and economic statistics. It displays real-time prices of seven major markets along with daily updates of the put/call ratio and multiple breadth measurements. Lastly, it displays the Federal Reserve’s balance sheet and 4-week change of assets held to help investors keep abreast of important FED changes in policy.
Presented for both the Nasdaq and NYSE composites and updated at the end of each trading day, the market breadth section shows:
· the number of net 52-week highs and lows
· the actual number of new 52-week highs and 52-week lows.
· The percentage of volume traded on up stocks vs. total volume
· The percentage of stocks advancing vs. all stocks
· Percentage of stocks above their 5-day average
· Percentage of stocks above their 50-day average
· Percentage of stocks above their 200-day average
In addition to presenting all of this valuable information in a table, users can hide the table and plot each market and economic data point. This is very helpful when viewing trends as well as overbought and oversold levels for these data points.
Presented for both the Nasdaq and NYSE composites and updated at the end of each trading day, the market breadth section shows:
· the number of net 52-week highs and lows
· the actual number of new 52-week highs and 52-week lows.
· The percentage of volume traded on up stocks vs. total volume
· The percentage of stocks advancing vs. all stocks
· Percentage of stocks above their 5-day average
· Percentage of stocks above their 50-day average
· Percentage of stocks above their 200-day average
In addition to presenting all of this valuable information in a table, users can hide the table and plot each market and economic data point. This is very helpful when viewing trends as well as overbought and oversold levels for these data points.
Informacje o Wersji
Version 2.0■ Intraday support.
■ Add option to change market data symbols.
Informacje o Wersji
Bug Fix■ The SPY cell now correctly displays text green or red depending on the daily change.
■ New symbol names now display correctly if the dashboard's breadth stats are not shown
Dostępne w Płatnej Przestrzeni
Ten wskaźnik jest dostępny wyłącznie dla subskrybentów Caruso Insights Custom Indicators. Dołącz, aby uzyskać dostęp do tego oraz innych skryptów autorstwa CarusoInsights.

Get access to CarusoInsights indicators: carusoinsights.com/charting/
Wyłączenie odpowiedzialności
Informacje i publikacje nie stanowią i nie powinny być traktowane jako porady finansowe, inwestycyjne, tradingowe ani jakiekolwiek inne rekomendacje dostarczane lub zatwierdzone przez TradingView. Więcej informacji znajduje się w Warunkach użytkowania.
Dostępne w Płatnej Przestrzeni
Ten wskaźnik jest dostępny wyłącznie dla subskrybentów Caruso Insights Custom Indicators. Dołącz, aby uzyskać dostęp do tego oraz innych skryptów autorstwa CarusoInsights.
Get access to CarusoInsights indicators: carusoinsights.com/charting/
Wyłączenie odpowiedzialności
Informacje i publikacje nie stanowią i nie powinny być traktowane jako porady finansowe, inwestycyjne, tradingowe ani jakiekolwiek inne rekomendacje dostarczane lub zatwierdzone przez TradingView. Więcej informacji znajduje się w Warunkach użytkowania.