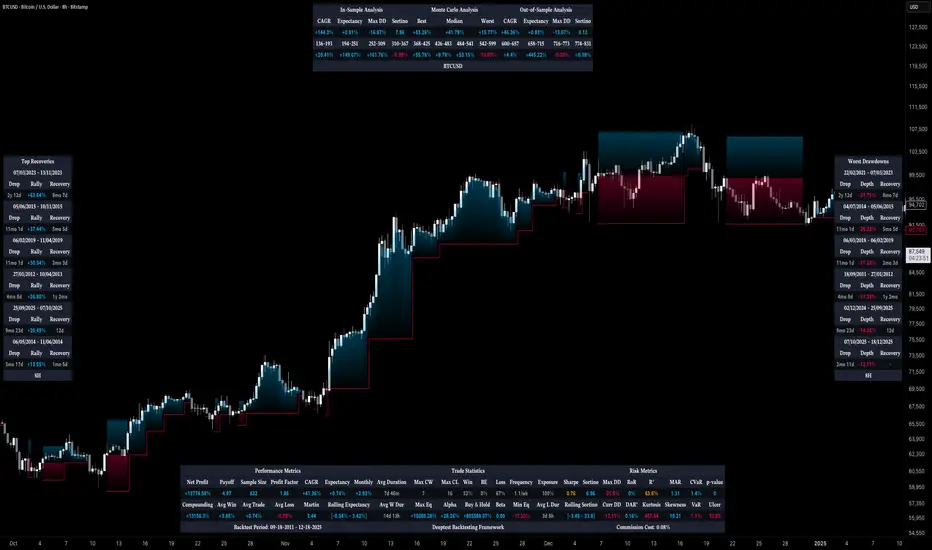
Deeptest: Quantitative Backtesting Library for Pine Script
━━━━━━━━━━━━━━━━━━━━━━━━━━━━━━━━━━
█ OVERVIEW
Deeptest is a Pine Script library that provides quantitative analysis tools for strategy backtesting. It calculates over 100 statistical metrics including risk-adjusted return ratios (Sharpe, Sortino, Calmar), drawdown analysis, Value at Risk (VaR), Conditional VaR, and performs Monte Carlo simulation and Walk-Forward Analysis.

█ WHY THIS LIBRARY MATTERS
Pine Script is a simple yet effective coding language for algorithmic and quantitative trading. Its accessibility enables traders to quickly prototype and test ideas directly within TradingView. However, the built-in strategy tester provides only basic metrics (net profit, win rate, drawdown), which is often insufficient for serious strategy evaluation.
Due to this limitation, many traders migrate to alternative backtesting platforms that offer comprehensive analytics. These platforms require other language programming knowledge, environment setup, and significant time investment—often just to test a simple trading idea.
Deeptest bridges this gap by bringing institutional-level quantitative analytics directly to Pine Script. Traders can now perform sophisticated analysis without leaving TradingView or learning complex external platforms. All calculations are derived from strategy.closedtrades.* , ensuring compatibility with any existing Pine Script strategy.
━━━━━━━━━━━━━━━━━━━━━━━━━━━━━━━━━━
█ ORIGINALITY AND USEFULNESS
This library is original work that adds value to the TradingView community in the following ways:
1. Comprehensive Metric Suite: Implements 112+ statistical calculations in a single library, including advanced metrics not available in TradingView's built-in tester (p-value, Z-score, Skewness, Kurtosis, Risk of Ruin).
2. Monte Carlo Simulation: Implements trade-sequence randomization to stress-test strategy robustness by simulating 1000+ alternative equity curves.
3. Walk-Forward Analysis: Divides historical data into rolling in-sample and out-of-sample windows to detect overfitting by comparing training vs. testing performance.
4. Rolling Window Statistics: Calculates time-varying Sharpe, Sortino, and Expectancy to analyze metric consistency throughout the backtest period.
5. Interactive Table Display: Renders professional-grade tables with color-coded thresholds, tooltips explaining each metric, and period analysis cards for drawdowns/trades.
6. Benchmark Comparison: Automatically fetches S&P 500 data to calculate Alpha, Beta, and R-squared, enabling objective assessment of strategy skill vs. passive investing.

━━━━━━━━━━━━━━━━━━━━━━━━━━━━━━━━━━
█ KEY FEATURES
Performance Metrics
Risk Metrics
Statistical Distribution
Trade Analysis
Advanced Analytics
Benchmark Comparison

━━━━━━━━━━━━━━━━━━━━━━━━━━━━━━━━━━
█ QUICK START
Basic Usage
Pine Script®
━━━━━━━━━━━━━━━━━━━━━━━━━━━━━━━━━━
█ METRIC EXPLANATIONS
The Deeptest table displays 23 metrics across the main row, with 23 additional metrics in the complementary row. Each metric includes detailed tooltips accessible by hovering over the value.
Main Row — Performance Metrics (Columns 0-6)
Main Row — Trade Statistics (Columns 7-14)
Main Row — Risk Metrics (Columns 15-22)

Complementary Row — Extended Metrics

━━━━━━━━━━━━━━━━━━━━━━━━━━━━━━━━━━
█ MONTE CARLO SIMULATION
Purpose
Monte Carlo simulation tests strategy robustness by randomizing the order of trades while keeping trade returns unchanged. This simulates alternative equity curves to assess outcome variability.
Method
Output
The stress test table shows:
Interpretation

━━━━━━━━━━━━━━━━━━━━━━━━━━━━━━━━━━
█ WALK-FORWARD ANALYSIS
Purpose
Walk-Forward Analysis (WFA) is the gold standard for detecting strategy overfitting. It simulates real-world trading by dividing historical data into rolling "training" (in-sample) and "validation" (out-of-sample) periods. A strategy that performs well on unseen data is more likely to succeed in live trading.
Method
The implementation uses a non-overlapping window approach following AmiBroker's gold standard methodology:
Output
Interpretation
Key Principles:

━━━━━━━━━━━━━━━━━━━━━━━━━━━━━━━━━━
█ TABLE DISPLAY
Main Table — Organized into three sections:
Color Coding
━━━━━━━━━━━━━━━━━━━━━━━━━━━━━━━━━━
█ IMPLEMENTATION NOTES
━━━━━━━━━━━━━━━━━━━━━━━━━━━━━━━━━━
█ QUICK NOTES
➙ This library has been developed and refined over two years of real-world strategy testing. Every calculation has been validated against industry-standard quantitative finance references.
➙ The entire codebase is thoroughly documented inline. If you are curious about how a metric is calculated or want to understand the implementation details, dive into the source code -- it is written to be read and learned from.
➙ This description focuses on usage and concepts rather than exhaustively listing every exported type and function. The library source code is thoroughly documented inline -- explore it to understand implementation details and internal logic.
➙ All calculations execute on barstate.islastconfirmedhistory to minimize runtime overhead. The library is designed for efficiency without sacrificing accuracy.
➙ Beyond analysis, this library serves as a learning resource. Study the source code to understand quantitative finance concepts, Pine Script advanced techniques, and proper statistical methodology.
➙ Metrics are their own not binary good/bad indicators. A high Sharpe ratio with low sample size is misleading. A deep drawdown during a market crash may be acceptable. Study each function and metric individually -- evaluate your strategy contextually, not by threshold alone.
➙ All strategies face alpha decay over time. Instead of over-optimizing a single strategy on one timeframe and market, build a diversified portfolio across multiple markets and timeframes. Deeptest helps you validate each component so you can combine robust strategies into a trading portfolio.
➙ Screenshots shown in the documentation are solely for visual representation to demonstrate how the tables and metrics will be displayed. Please do not compare your strategy's performance with the metrics shown in these screenshots -- they are illustrative examples only, not performance targets or benchmarks.
━━━━━━━━━━━━━━━━━━━━━━━━━━━━━━━━━━
█ HOW-TO
Using Deeptest is intentionally straightforward. Just import the library and callPine Script® at the end of your strategy code in main scope. .
Pine Script®
And yes... it's compatible with any TradingView Strategy! 🪄
━━━━━━━━━━━━━━━━━━━━━━━━━━━━━━━━━━
█ CREDITS
Author: Fractalyst
Font Library: by fikira - kaigouthro - Duyck
Community: Inspired by the PineCoders community initiative, encouraging developers to contribute open-source libraries and continuously enhance the Pine Script ecosystem for all traders.
if you find Deeptest valuable in your trading journey, feel free to use it in your strategies and give a shoutout to Fractalyst -- Your recognition directly supports ongoing development and open-source contributions to Pine Script.
━━━━━━━━━━━━━━━━━━━━━━━━━━━━━━━━━━
█ DISCLAIMER
This library is provided for educational and research purposes. Past performance does not guarantee future results. Always test thoroughly and use proper risk management. The author is not responsible for any trading losses incurred through the use of this code.
━━━━━━━━━━━━━━━━━━━━━━━━━━━━━━━━━━
█ OVERVIEW
Deeptest is a Pine Script library that provides quantitative analysis tools for strategy backtesting. It calculates over 100 statistical metrics including risk-adjusted return ratios (Sharpe, Sortino, Calmar), drawdown analysis, Value at Risk (VaR), Conditional VaR, and performs Monte Carlo simulation and Walk-Forward Analysis.
█ WHY THIS LIBRARY MATTERS
Pine Script is a simple yet effective coding language for algorithmic and quantitative trading. Its accessibility enables traders to quickly prototype and test ideas directly within TradingView. However, the built-in strategy tester provides only basic metrics (net profit, win rate, drawdown), which is often insufficient for serious strategy evaluation.
Due to this limitation, many traders migrate to alternative backtesting platforms that offer comprehensive analytics. These platforms require other language programming knowledge, environment setup, and significant time investment—often just to test a simple trading idea.
Deeptest bridges this gap by bringing institutional-level quantitative analytics directly to Pine Script. Traders can now perform sophisticated analysis without leaving TradingView or learning complex external platforms. All calculations are derived from strategy.closedtrades.* , ensuring compatibility with any existing Pine Script strategy.
━━━━━━━━━━━━━━━━━━━━━━━━━━━━━━━━━━
█ ORIGINALITY AND USEFULNESS
This library is original work that adds value to the TradingView community in the following ways:
1. Comprehensive Metric Suite: Implements 112+ statistical calculations in a single library, including advanced metrics not available in TradingView's built-in tester (p-value, Z-score, Skewness, Kurtosis, Risk of Ruin).
2. Monte Carlo Simulation: Implements trade-sequence randomization to stress-test strategy robustness by simulating 1000+ alternative equity curves.
3. Walk-Forward Analysis: Divides historical data into rolling in-sample and out-of-sample windows to detect overfitting by comparing training vs. testing performance.
4. Rolling Window Statistics: Calculates time-varying Sharpe, Sortino, and Expectancy to analyze metric consistency throughout the backtest period.
5. Interactive Table Display: Renders professional-grade tables with color-coded thresholds, tooltips explaining each metric, and period analysis cards for drawdowns/trades.
6. Benchmark Comparison: Automatically fetches S&P 500 data to calculate Alpha, Beta, and R-squared, enabling objective assessment of strategy skill vs. passive investing.
━━━━━━━━━━━━━━━━━━━━━━━━━━━━━━━━━━
█ KEY FEATURES
Performance Metrics
- Net Profit, CAGR, Monthly Return, Expectancy
- Profit Factor, Payoff Ratio, Sample Size
- Compounding Effect Analysis
Risk Metrics
- Sharpe Ratio, Sortino Ratio, Calmar Ratio (MAR)
- Martin Ratio, Ulcer Index
- Max Drawdown, Average Drawdown, Drawdown Duration
- Risk of Ruin, R-squared (equity curve linearity)
Statistical Distribution
- Value at Risk (VaR 95%), Conditional VaR
- Skewness (return asymmetry)
- Kurtosis (tail fatness)
- Z-Score, p-value (statistical significance testing)
Trade Analysis
- Win Rate, Breakeven Rate, Loss Rate
- Average Trade Duration, Time in Market
- Consecutive Win/Loss Streaks with Expected values
- Top/Worst Trades with R-multiple tracking
Advanced Analytics
- Monte Carlo Simulation (1000+ iterations)
- Walk-Forward Analysis (rolling windows)
- Rolling Statistics (time-varying metrics)
- Out-of-Sample Testing
Benchmark Comparison
- Alpha (excess return vs. benchmark)
- Beta (systematic risk correlation)
- Buy & Hold comparison
- R-squared vs. benchmark
━━━━━━━━━━━━━━━━━━━━━━━━━━━━━━━━━━
█ QUICK START
Basic Usage
━━━━━━━━━━━━━━━━━━━━━━━━━━━━━━━━━━
█ METRIC EXPLANATIONS
The Deeptest table displays 23 metrics across the main row, with 23 additional metrics in the complementary row. Each metric includes detailed tooltips accessible by hovering over the value.
Main Row — Performance Metrics (Columns 0-6)
- Net Profit — (Final Equity - Initial Capital) / Initial Capital × 100
— >20%: Excellent, >0%: Profitable, <0%: Loss
— Total return percentage over entire backtest period - Payoff Ratio — Average Win / Average Loss
— >1.5: Excellent, >1.0: Good, <1.0: Losses exceed wins
— Average winning trade size relative to average losing trade. Breakeven win rate = 100% / (1 + Payoff) - Sample Size — Count of closed trades
— >=30: Statistically valid, <30: Insufficient data
— Number of completed trades. Includes 95% confidence interval for win rate in tooltip - Profit Factor — Gross Profit / Gross Loss
— >=1.5: Excellent, >1.0: Profitable, <1.0: Losing
— Ratio of total winnings to total losses. Uses absolute values unlike payoff ratio - CAGR — (Final / Initial)^(365.25 / Days) - 1
— >=10%: Excellent, >0%: Positive growth
— Compound Annual Growth Rate - annualized return accounting for compounding - Expectancy — Sum of all returns / Trade count
— >0.20%: Excellent, >0%: Positive edge
— Average return per trade as percentage. Positive expectancy indicates profitable edge - Monthly Return — Net Profit / (Months in test)
— >0%: Profitable month average
— Average monthly return. Geometric monthly also shown in tooltip
Main Row — Trade Statistics (Columns 7-14)
- Avg Duration — Average time in position per trade
— Mean holding period from entry to exit. Influenced by timeframe and trading style - Max CW — Longest consecutive winning streak
— Maximum consecutive wins. Expected value = ln(trades) / ln(1/winRate) - Max CL — Longest consecutive losing streak
— Maximum consecutive losses. Important for psychological risk tolerance - Win Rate — Wins / Total Trades
— Higher is better
— Percentage of profitable trades. Breakeven win rate shown in tooltip - BE Rate — Breakeven Trades / Total Trades
— Lower is better
— Percentage of trades that broke even (neither profit nor loss) - Loss Rate — Losses / Total Trades
— Lower is better
— Percentage of unprofitable trades. Together with win rate and BE rate, sums to 100% - Frequency — Trades per month
— Trading activity level. Displays intelligently (e.g., "12/mo", "1.5/wk", "3/day") - Exposure — Time in market / Total time × 100
— Lower = less risk
— Percentage of time the strategy had open positions
Main Row — Risk Metrics (Columns 15-22)
- Sharpe Ratio — (Return - Rf) / StdDev × sqrt(Periods)
— >=3: Excellent, >=2: Good, >=1: Fair, <1: Poor
— Measures risk-adjusted return using total volatility. Annualized using sqrt(252) for daily - Sortino Ratio — (Return - Rf) / DownsideDev × sqrt(Periods)
— >=2: Excellent, >=1: Good, <1: Needs improvement
— Similar to Sharpe but only penalizes downside volatility. Can be higher than Sharpe - Max DD — (Peak - Trough) / Peak × 100
— <5%: Excellent, 5-15%: Moderate, 15-30%: High, >30%: Severe
— Largest peak-to-trough decline in equity. Critical for risk tolerance and position sizing - RoR — Risk of Ruin probability
— <1%: Excellent, 1-5%: Acceptable, 5-10%: Elevated, >10%: Dangerous
— Probability of losing entire trading account based on win rate and payoff ratio - R² — R-squared of equity curve vs. time
— >=0.95: Excellent, 0.90-0.95: Good, 0.80-0.90: Moderate, <0.80: Erratic
— Coefficient of determination measuring linearity of equity growth - MAR — CAGR / |Max Drawdown|
— Higher is better, negative = bad
— Calmar Ratio. Reward relative to worst-case loss. Negative if max DD exceeds CAGR - CVaR — Average of returns below VaR threshold
— Lower absolute is better
— Conditional Value at Risk (Expected Shortfall). Average loss in worst 5% of outcomes - p-value — Binomial test probability
— <0.05: Significant, 0.05-0.10: Marginal, >0.10: Likely random
— Probability that observed results are due to chance. Low p-value means statistically significant edge
Complementary Row — Extended Metrics
- Compounding — (Compounded Return / Total Return) × 100
— Percentage of total profit attributable to compounding (position sizing) - Avg Win — Sum of wins / Win count
— Average profitable trade return in percentage - Avg Trade — Sum of all returns / Total trades
— Same as Expectancy (Column 5). Displayed here for convenience - Avg Loss — Sum of losses / Loss count
— Average unprofitable trade return in percentage (negative value) - Martin Ratio — CAGR / Ulcer Index
— Similar to Calmar but uses Ulcer Index instead of Max DD - Rolling Expectancy — Mean of rolling window expectancies
— Average expectancy calculated across rolling windows. Shows consistency of edge - Avg W Dur — Avg duration of winning trades
— Average time from entry to exit for winning trades only - Max Eq — Highest equity value reached
— Peak equity achieved during backtest - Min Eq — Lowest equity value reached
— Trough equity point. Important for understanding worst-case absolute loss - Buy & Hold — (Close_last / Close_first - 1) × 100
— >0%: Passive profit
— Return of simply buying and holding the asset from backtest start to end - Alpha — Strategy CAGR - Benchmark CAGR
— >0: Has skill (beats benchmark)
— Excess return above passive benchmark. Positive alpha indicates genuine value-added skill - Beta — Covariance(Strategy, Benchmark) / Variance(Benchmark)
— <1: Less volatile than market, >1: More volatile
— Systematic risk correlation with benchmark - Avg L Dur — Avg duration of losing trades
— Average time from entry to exit for losing trades only - Rolling Sharpe/Sortino — Dynamic based on win rate
— >2: Good consistency
— Rolling metric across sliding windows. Shows Sharpe if win rate >50%, Sortino if <=50% - Curr DD — Current drawdown from peak
— Lower is better
— Present drawdown percentage. Zero means at new equity high - DAR — CAGR adjusted for target DD
— Higher is better
— Drawdown-Adjusted Return. DAR^5 = CAGR if max DD = 5% - Kurtosis — Fourth moment / StdDev^4 - 3
— ~0: Normal, >0: Fat tails, <0: Thin tails
— Measures "tailedness" of return distribution (excess kurtosis) - Skewness — Third moment / StdDev^3
— >0: Positive skew (big wins), <0: Negative skew (big losses)
— Return distribution asymmetry - VaR — 5th percentile of returns
— Lower absolute is better
— Value at Risk at 95% confidence. Maximum expected loss in worst 5% of outcomes - Ulcer — sqrt(mean(drawdown^2))
— Lower is better
— Ulcer Index - root mean square of drawdowns. Penalizes both depth AND duration
━━━━━━━━━━━━━━━━━━━━━━━━━━━━━━━━━━
█ MONTE CARLO SIMULATION
Purpose
Monte Carlo simulation tests strategy robustness by randomizing the order of trades while keeping trade returns unchanged. This simulates alternative equity curves to assess outcome variability.
Method
- Extract all historical trade returns
- Randomly shuffle the sequence (1000+ iterations)
- Calculate cumulative equity for each shuffle
- Build distribution of final outcomes
Output
The stress test table shows:
- Median Outcome: 50th percentile result
- 5th Percentile: Worst 5% of outcomes
- 95th Percentile: Best 95% of outcomes
- Success Rate: Percentage of simulations that were profitable
Interpretation
- If 95% of simulations are profitable: Strategy is robust
- If median is far from actual result: High variance/unreliability
- If 5th percentile shows large loss: High tail risk
━━━━━━━━━━━━━━━━━━━━━━━━━━━━━━━━━━
█ WALK-FORWARD ANALYSIS
Purpose
Walk-Forward Analysis (WFA) is the gold standard for detecting strategy overfitting. It simulates real-world trading by dividing historical data into rolling "training" (in-sample) and "validation" (out-of-sample) periods. A strategy that performs well on unseen data is more likely to succeed in live trading.
Method
The implementation uses a non-overlapping window approach following AmiBroker's gold standard methodology:
- Segment Calculation: Total trades divided into N windows (default: 12), IS = ~75%, OOS = ~25%, Step = OOS length
- Window Structure: Each window has IS (training) followed by OOS (validation). Each OOS becomes the next window's IS (rolling forward)
- Metrics Calculated: CAGR, Sharpe, Sortino, MaxDD, Win Rate, Expectancy, Profit Factor, Payoff
- Aggregation: IS metrics averaged across all IS periods, OOS metrics averaged across all OOS periods
Output
- IS CAGR: In-sample annualized return
- OOS CAGR: Out-of-sample annualized return (THE key metric)
- IS/OOS Sharpe: In/out-of-sample risk-adjusted return
- Success Rate: % of OOS windows that were profitable
Interpretation
- Robust: IS/OOS CAGR gap <20%, OOS Success Rate >80%
- Some Overfitting: CAGR gap 20-50%, Success Rate 50-80%
- Severe Overfitting: CAGR gap >50%, Success Rate <50%
Key Principles:
- OOS is what matters — Only OOS predicts live performance
- Consistency > Magnitude — 10% IS / 9% OOS beats 30% IS / 5% OOS
- Window count — More windows = more reliable validation
- Non-overlapping OOS — Prevents data leakage
━━━━━━━━━━━━━━━━━━━━━━━━━━━━━━━━━━
█ TABLE DISPLAY
Main Table — Organized into three sections:
- Performance Metrics (Cols 0-6): Net Profit, Payoff, Sample Size, Profit Factor, CAGR, Expectancy, Monthly
- Trade Statistics (Cols 7-14): Avg Duration, Max CW, Max CL, Win, BE, Loss, Frequency, Exposure
- Risk Metrics (Cols 15-22): Sharpe, Sortino, Max DD, RoR, R², MAR, CVaR, p-value
Color Coding
- 🟢 Green: Excellent performance
- 🟠 Orange: Acceptable performance
- ⚪ Gray: Neutral / Fair
- 🔴 Red: Poor performance
━━━━━━━━━━━━━━━━━━━━━━━━━━━━━━━━━━
█ IMPLEMENTATION NOTES
- Data Source: All metrics calculated from strategy.closedtrades, ensuring compatibility with any Pine Script strategy
- Calculation Timing: All calculations occur on barstate.islastconfirmedhistory to optimize performance
- Limitations: Requires at least 1 closed trade for basic metrics, 30+ trades for reliable statistical analysis
━━━━━━━━━━━━━━━━━━━━━━━━━━━━━━━━━━
█ QUICK NOTES
➙ This library has been developed and refined over two years of real-world strategy testing. Every calculation has been validated against industry-standard quantitative finance references.
➙ The entire codebase is thoroughly documented inline. If you are curious about how a metric is calculated or want to understand the implementation details, dive into the source code -- it is written to be read and learned from.
➙ This description focuses on usage and concepts rather than exhaustively listing every exported type and function. The library source code is thoroughly documented inline -- explore it to understand implementation details and internal logic.
➙ All calculations execute on barstate.islastconfirmedhistory to minimize runtime overhead. The library is designed for efficiency without sacrificing accuracy.
➙ Beyond analysis, this library serves as a learning resource. Study the source code to understand quantitative finance concepts, Pine Script advanced techniques, and proper statistical methodology.
➙ Metrics are their own not binary good/bad indicators. A high Sharpe ratio with low sample size is misleading. A deep drawdown during a market crash may be acceptable. Study each function and metric individually -- evaluate your strategy contextually, not by threshold alone.
➙ All strategies face alpha decay over time. Instead of over-optimizing a single strategy on one timeframe and market, build a diversified portfolio across multiple markets and timeframes. Deeptest helps you validate each component so you can combine robust strategies into a trading portfolio.
➙ Screenshots shown in the documentation are solely for visual representation to demonstrate how the tables and metrics will be displayed. Please do not compare your strategy's performance with the metrics shown in these screenshots -- they are illustrative examples only, not performance targets or benchmarks.
━━━━━━━━━━━━━━━━━━━━━━━━━━━━━━━━━━
█ HOW-TO
Using Deeptest is intentionally straightforward. Just import the library and call
And yes... it's compatible with any TradingView Strategy! 🪄
━━━━━━━━━━━━━━━━━━━━━━━━━━━━━━━━━━
█ CREDITS
Author: Fractalyst
Font Library: by fikira - kaigouthro - Duyck
Community: Inspired by the PineCoders community initiative, encouraging developers to contribute open-source libraries and continuously enhance the Pine Script ecosystem for all traders.
if you find Deeptest valuable in your trading journey, feel free to use it in your strategies and give a shoutout to Fractalyst -- Your recognition directly supports ongoing development and open-source contributions to Pine Script.
━━━━━━━━━━━━━━━━━━━━━━━━━━━━━━━━━━
█ DISCLAIMER
This library is provided for educational and research purposes. Past performance does not guarantee future results. Always test thoroughly and use proper risk management. The author is not responsible for any trading losses incurred through the use of this code.
Informacje o Wersji
v2Updated:
runDeeptest(riskPerTrade, targetMaxDDPct, showStressTest, showPeriodCards, wfaWindows, mcSimulations, bullColor, bearColor, commissionInfo, benchmarkReturns, benchmarkSymbol, periodCardMode, tradeSortBy, textSize)
Parameters:
riskPerTrade (float)
targetMaxDDPct (float)
showStressTest (bool)
showPeriodCards (bool)
wfaWindows (int)
mcSimulations (int)
bullColor (color)
bearColor (color)
commissionInfo (string)
benchmarkReturns (array<float>)
benchmarkSymbol (string)
periodCardMode (string)
tradeSortBy (string)
textSize (string)
Informacje o Wersji
v3Updated:
runDeeptest(riskPerTrade, targetMaxDDPct, bullColor, bearColor, warningColor, tableBg, headerBg, borderColor, textPrimary, textMuted, textSize, showComplementaryRow, showStressTestTable, showDrawdownRecoveryCards, showTradeCards)
Parameters:
riskPerTrade (float)
targetMaxDDPct (float)
bullColor (color)
bearColor (color)
warningColor (color)
tableBg (color)
headerBg (color)
borderColor (color)
textPrimary (color)
textMuted (color)
textSize (string)
showComplementaryRow (bool)
showStressTestTable (bool)
showDrawdownRecoveryCards (bool)
showTradeCards (bool)
This update delivers critical stability improvements, performance optimizations, and full theme customization.
█ 🐛 BUG FIXES
Empty Array Protection
Fixed runtime crashes when statistical functions received empty arrays. `calcArrayMeanStd()`, `calcArrayPercentile()`, and `calcRollingExpectancy()` now safely return `na` instead of triggering "Array index out of bounds" errors. Applied consistently across all rolling window, percentile, and statistical aggregation functions.
Table Persistence
Fixed tables disappearing on realtime bars. Implemented two-phase architecture: calculations run once on `barstate.islastconfirmedhistory`, rendering runs on every `barstate.islast` to keep tables visible throughout the session.
█ ⚡ PERFORMANCE
Cached Value Architecture
All computations now cached using `var` declarations: `_dp_cachedReturns`, `_dp_cachedRolling`, `_dp_cachedConfig`, `_dp_cachedStress`, `_dp_cachedTopTrades`, `_dp_cachedWorstTrades`, `_dp_cachedDrawdowns`, `_dp_cachedRecoveries`. Results: ~95% reduction in realtime calculation time, optimized memory allocation, instantaneous table rendering.
Benchmark Update
Changed from SPX to SPY for broader broker compatibility and consistent daily data for Alpha/Beta calculations.
█ USER INPUTS FOR CUSTOMIZATION
Copy and paste this code block into your strategy to enable full Deeptest customization:
Special thanks to shonofear and ASTraiding for reporting the errors.
Informacje o Wersji
v4Updated:
runDeeptest(targetMaxDDPct, bullColor, bearColor, tableBg, headerBg, borderColor, textPrimary, textMuted, textSize, showComplementaryRow, showStressTestTable, showDrawdownRecoveryCards, showTradeCards)
Parameters:
targetMaxDDPct (float)
bullColor (color)
bearColor (color)
tableBg (color)
headerBg (color)
borderColor (color)
textPrimary (color)
textMuted (color)
textSize (string)
showComplementaryRow (bool)
showStressTestTable (bool)
showDrawdownRecoveryCards (bool)
showTradeCards (bool)
Changed
- Removed riskPerTrade parameter from calculateFromStrategy() and runDeeptest() - now auto-calculated from avgLossPct
- Optimized array operations with preallocation instead of array.push()
- Moved request.security() calls inside conditionals to avoid unnecessary execution
calcVaRCVaR() now uses array.sum() instead of manual loop
Added
- calcCurrentDrawdownBoth() - returns both percentage and dollar drawdown in single pass
- Deep backtest detection - skips calculations when last_bar_index > 50000
Fixed
- Expectancy tooltip formatting
- Avg loss displayed as negative in tooltips
Informacje o Wersji
v5- Fixed: Table visibility issue when market closed or calc_on_every_tick = false
Informacje o Wersji
v6- Fixed: Table visibility issue when market closed and calc_on_every_tick = true
Informacje o Wersji
v7Highlights
- Trade-path max drawdown via calcReturnsMaxDDPct() for accurate IS/OOS mirrored metrics (prevents window aggregation from hiding intrawindow drawdowns)
- Centralized bootstrap RNG helper _getBootstrapSampleIndex() using built-in math.random()
- Conditional convergence to official strategy.* built-ins for average trade metrics once parity is confirmed (reduces redundant calculations while preserving correctness)
- Expanded documentation and inline comments for Monte Carlo and Walk-Forward paths (methodology + design trade-offs)
Breaking changes
- Refactored core array helpers to use for...in iteration instead of fragile 0..n-1 indexing (safer on empty arrays and less error-prone)
Changed
- Modernized Monte Carlo sampling to use deterministic seeded math.random() instead of duplicated manual LCG logic
- Updated calcArrayMeanStd, calcArrayPercentile, collectMetricValues, and getSortedIndices to safer iteration patterns (better NA/empty-collection guards)
- computeWalkForward(): IS/OOS Max DD is now overridden with trade-path values to avoid masking intrawindow drawdowns
- Removed nz() coercion for IS/OOS Max DD in stress table rendering to avoid false 0% displays when the value is NA
Fixed
- IS/OOS mirrored Max DD sometimes showing 0% due to window-level aggregation masking actual drawdowns
- Pine loop safety issues where for i = 0 to n-1 could still execute with n = 0, causing runtime errors
- Array slice edge cases where array.slice(array, 0, 0) could fail on empty arrays
- NA handling in percentile and median calculations to prevent silent failures and incorrect downstream metrics
Deprecated
- Manual LCG random number generation in Monte Carlo paths (replaced by built-in math.random())
- Custom average trade calculations when official strategy.* metrics match within tolerance (built-ins preferred once validated)
Security / Robustness
- Improved NA handling across array utilities to prevent runtime errors and misleading default values
- Enhanced loop safety guards to prevent out-of-bounds access on empty collections
Documentation
- Added detailed function headers (parameters, return types, and intent)
- Improved inline comments explaining trade-offs and implementation choices
- Documented Monte Carlo bootstrap sampling methodology and rationale
- Clarified Walk-Forward window segmentation logic (per-window vs stitched-path measurements)
Performance
- Reduced redundant calculations for average trade metrics by preferring strategy.* built-ins when safe
- Optimized array iteration patterns to reduce Pine runtime overhead
- Centralized RNG to eliminate duplicate seed management paths
Informacje o Wersji
v8Faster Script Loading
- Deeptest now loads ~10-20% faster on strategies with 200+ trades by eliminating redundant data fetching and repeated calculations behind the scenes
- Market data requests reduced by two-thirds (one SPY request handles everything instead of three separate calls)
Live-Updating Metrics
- Current Drawdown now reflects your real-time equity against the running high, not just the last closed trade
- Buy & Hold benchmark updates with the current bar's close price
- Alpha recalculates automatically from the live benchmark
- Net Profit stays in sync with `strategy.equity` on every tick
Visual Fixes
- Kurtosis and Skewness cells now display the correct color thresholds
- Top Trades and Worst Trades cards render consistently using shared layout logic
Compatibility
- Zero breaking changes — `runDeeptest()` API is identical to v7
Informacje o Wersji
v9Updated:
runDeeptest(targetMaxDDPct, bullColor, bearColor, tableBg, headerBg, borderColor, textPrimary, textMuted, textSize, showComplementaryRow, showStressTestTable, showDrawdownRecoveryCards, showTradeCards, enableLogging)
Parameters:
targetMaxDDPct (float)
bullColor (color)
bearColor (color)
tableBg (color)
headerBg (color)
borderColor (color)
textPrimary (color)
textMuted (color)
textSize (string)
showComplementaryRow (bool)
showStressTestTable (bool)
showDrawdownRecoveryCards (bool)
showTradeCards (bool)
enableLogging (bool)
VERSION 9 (02.04.2026) - Accuracy & Performance Release
--------------------------------------------------------
Bug fixes, tighter statistical methods, faster WFA, and
Data Window logging support.
Accuracy Fixes:
• Sharpe ratio: Risk-free rate now applied before the zero-stddev
branch, capping correctly when volatility is near-zero
• Alpha: Buy & Hold return converted to CAGR before comparison
(was raw total return vs strategy CAGR, inflating alpha)
• CVaR tail boundary: Now averages returns strictly worse than
the VaR quantile instead of including it
• Live drawdown: Sign corrected to positive during drawdown
(peakEquity - strategy.equity was reversed)
• Risk of Ruin: Was showing decimal form (0.05) instead of % (5.00%)
Performance Optimizations:
• Equity curve drawdown metrics consolidated from 3 loops into 1
single-pass function (calcDrawdownMetrics)
• Skewness and kurtosis merged into 1 shared-moments pass
(calcSkewKurtosis)
• Walk-Forward IS/OOS trade aggregation now pushes directly to
result arrays, eliminating intermediate copy loops
• OOS Sharpe/Sortino helper collects returns inline in main loop
New Feature:
• enableLogging parameter on runDeeptest() — outputs all 112+
metrics to Pine Script Data Window via log.info()
Display Improvements:
• Expectancy formula: (WR × AvgWin) - (LR × AvgLoss)
• Avg Trade tooltip: mathematically correct description
• Rolling Expectancy & Sortino/Sharpe tooltips: replaced IQR
quartile coloring with worst-case resilience model
Compatibility:
• Zero breaking changes — enableLogging defaults to false
• Alpha and CVaR values differ from v8 due to formula corrections
Informacje o Wersji
v10• Merged trade extraction into single-pass — faster backtest computation
• Inlined Monte Carlo statistics — eliminates per-simulation overhead
• Removed 5 dead functions superseded by consolidated implementations
• Fixed alpha calculation accuracy (population vs sample variance)
• Fixed recovery "<1s" display artifact (sub-minute guard)
• Fixed recovery table not rendering (visibility condition)
• Verified built-in compatibility: array.avg/stdev/percentile require na-filtering
• Removed 8 dead functions: extractTradeReturns, buildEquityCurve, MaxCW,
MaxCL, Frequency, calcSkewness, calcKurtosis, calcVaR (~866 lines)
• Merged calcTopDrawdowns + calcTopRecoveries into single-pass
calcDrawdownCycles — eliminates duplicate O(n) equity iterations
• Consolidated buildSharpeTooltip + buildSortinoTooltip
• Zero breaking changes — public API unchanged
Informacje o Wersji
v11Updated:
runDeeptest(targetMaxDDPct, bullColor, bearColor, tableBg, headerBg, borderColor, textPrimary, textMuted, textSize, showComplementaryRow, showStressTestTable, showDrawdownRecoveryCards, showTradeCards, showRExpectancy, enableLogging)
Parameters:
targetMaxDDPct (float)
bullColor (color)
bearColor (color)
tableBg (color)
headerBg (color)
borderColor (color)
textPrimary (color)
textMuted (color)
textSize (string)
showComplementaryRow (bool)
showStressTestTable (bool)
showDrawdownRecoveryCards (bool)
showTradeCards (bool)
showRExpectancy (bool)
enableLogging (bool)
Stats
Stats - Comprehensive backtest statistics container
Fields:
totalTrades (series int)
winTrades (series int)
lossTrades (series int)
evenTrades (series int)
winRate (series float)
lossRate (series float)
avgWinPct (series float)
avgLossPct (series float)
avgTradePct (series float)
profitFactor (series float)
payoffRatio (series float)
expectancy (series float)
rExpectancy (series float)
grossProfit (series float)
grossLoss (series float)
netProfit (series float)
netProfitPct (series float)
compEffect (series float)
sharpe (series float)
sortino (series float)
calmar (series float)
martin (series float)
maxDrawdown (series float)
maxDrawdownPct (series float)
currentDrawdown (series float)
currentDrawdownPct (series float)
avgDrawdownPct (series float)
maxEquity (series float)
minEquity (series float)
cagr (series float)
monthlyReturn (series float)
maxConsecWins (series int)
maxConsecLosses (series int)
avgTradeDuration (series float)
avgWinDuration (series float)
avgLossDuration (series float)
timeInMarketPct (series float)
tradesPerMonth (series float)
tradesPerYear (series float)
skewness (series float)
kurtosis (series float)
var95 (series float)
cvar95 (series float)
totalCommission (series float)
ulcerIndex (series float)
riskOfRuin (series float)
pValue (series float)
zScore (series float)
alpha (series float)
beta (series float)
buyHoldReturn (series float)
equityRSquared (series float)
firstTradeTime (series int)
lastTradeTime (series int)
tradingPeriodDays (series float)
--------------------------------------------------------------------
R-Expectancy normalizes edge measurement by expressing expected profit per trade as a multiple of average realized risk (1R = avgLossPct).
WHY IT MATTERS:
• Position-size independent — unlike % expectancy, R-expectancy remains
comparable across strategies with different sizing methods
• Cross-strategy comparable — a 0.5R edge on 2% risk equals a 0.5R edge
on 5% risk; % expectancy would show different numbers
• Professional standard — used by prop desks and systematic funds to
evaluate true alpha regardless of capital allocation
FORMULA:
R-Expectancy = winRate × (avgWinPct / avgLossPct) − lossRate
Equivalent to: expectancyPct / avgLossPct
INTERPRETATION:
> 0.2R = solid positive edge
> 0R = marginal edge (may not survive costs/slippage)
≤ 0R = negative expectation — strategy loses on average
CHANGES:
• Added showRExpectancy toggle to runDeeptest() — controls global display mode
• Added rExpectancy field to Stats, MirroredMetrics, WindowStats types
• Unified formula: expectancyPct / global avgLossPct (1R baseline)
• Stress test: IS/OOS/MC all display R-expectancy when enabled
• Rolling expectancy: range displayed as [minR - maxR] with R-thresholds
• Tooltips: dual display (% and R) for educational value
• Headers: dynamically switch between "Expectancy" and "R-Expect"
• Logging: R-expectancy values logged alongside % values
• Zero breaking changes — public API extended, not modified
Informacje o Wersji
VERSION 12 (11.04.2026) - Hurst Exponent + Custom Theme Colors + Code OptimizationHurst Exponent:
Measures long-term memory of time series via detrended fluctuation analysis
Custom Theme Colors:
Default colors are set directly in runDeeptest():
tableBg = #0b0f13 (dark background)
headerBg = #191e2c (slightly lighter header)
borderColor = #000000 (black border)
For customization, use input.color() in your strategy:
customBg = input.color(#0b0f13, "Table Background", group="Display")
customHeader = input.color(#191e2c, "Header Background", group="Display")
customBorder = input.color(#000000, "Border Color", group="Display")
runDeeptest(
tableBg=customBg,
headerBg=customHeader,
borderColor=customBorder,
...)
Code Optimization:
• Rolling Sharpe/Sortino/Expectancy: replaced manual accumulation loops
with array.slice() + array.avg()/stdev()/min()/max() built-ins
• Extracted calcRollingWindowSize() and pushWindowSummary() helpers
• Removed unused TopPeriodRecord type, 2 constants, 9 dead comments
• Zero calculation changes — all replacements algebraically identical
CHANGES:
• Removed theme system - now uses direct custom color parameters
• Default colors: tableBg=#0b0f13, headerBg=#191e2c, borderColor=#000000
• calcHurstExponent() rewritten with multi-scale R/S + OLS regression
• Added hurstExponent field to Stats type
• Hurst column inserted between "Curr DD" and "Kurtosis" (Col 18)
• Table expanded from 23 to 23 columns
• minDataPoints raised from 20 to 50 (need 3+ scales for regression)
• Added buildHurstTooltip() and _renderHurstCell() helpers
• Hurst included in log output
Informacje o Wersji
VERSION 13 (13.04.2026) - Accuracy Fix + Code Quality + Rolling Color Stability---------------------------------------------------------------------------
Accuracy Fix:
Sharpe ratio now uses sample standard deviation (biased=false, divisor n-1)
per Sharpe 1994. Previously used population stdev (biased=true, divisor n),
which understated volatility and overstated Sharpe by factor √(n/(n-1)).
At 30 trades the bias was ~1.7%; at 300 trades ~0.17%.
Also applied to rolling Sharpe windows and manual variance in OOS calc.
Hurst Exponent Rewrite:
Replaced single R/S method with dual-method R/S + DFA average:
• calcHurstRS() — classical rescaled range with inline OLS (no array alloc)
• calcHurstDFA() — detrended fluctuation analysis for non-stationary series
• calcHurstExponent() now averages both methods for robustness
• Applied to PRICE returns (not trade returns) for market regime detection
• Thresholds widened: bullish > 0.55, bearish < 0.45 (was >0.5 / <0.5)
• minSize raised from 10 to 20 for lower small-sample bias
Dead Code Removal:
• Deleted computeMonteCarlo() method (~30 lines) — superseded by inline MC
• Deleted COLOR_BORDER constant — all rendering uses config.colorBorder
• Deleted orphaned _dp_priceReturns accumulation block (9 lines) — Hurst now
uses trade returns array directly, matching DP_12 behavior
• Deleted unused MAX_HURST_PRICE_RETURNS constant
Accuracy Fix:
• Restored SENTINEL_MAX/MIN constants — incorrectly flagged as unreferenced
but used in 12 rolling window min/max tracking sites (Sharpe, Sortino,
Expectancy loops at lines 1935, 1972, 2063, 2110, 5114, 5135)
• Fixed calcHurstExponent — _dp_priceReturns accumulation was scoped inside
if-not-deep-backtest (unreachable in deep backtest path). Moved outside the
gate so price returns feed Hurst in both paths. Trade returns are too sparse
for reliable Hurst estimation (50-200 trades vs thousands of price bars)
Named Constants (was magic numbers):
• 18× literal 999.00 → INFINITY_CAP
• 10 stress test constants: RNG_PRIME, RNG_MULT_1/2, MAX_TOTAL_ITERATIONS,
MIN_STRESS_TRADES, MIN_OOS_PERCENT, MAX_OOS_PERCENT, MIN_MC_SIMULATIONS,
DEEP_BACKTEST_BAR_LIMIT
Formatting Helpers:
• formatCapped() — replaces 38× repeated na/or/INFINITY_CAP ternary chains
• tooltipHeader() — replaces 26× FN.toFont("Name\n───\n\n", "Sans Bold")
• buildMetricTooltip() — consolidates 23 single-value tooltip function bodies
• formatSignedPct() — replaces 17× inline sign-prefix formatting
Shared Calculations:
• calcTimeUnits() — deduplicates time cascade in formatIntelligentFrequency
and buildFrequencyTooltip (identical perYear/Week/Day/Hour/Min/Sec cascade)
if/else → switch:
• formatDuration, formatIntelligentFrequency, superscriptDigits, formatValue
Logging Optimization:
• Replaced 55+ log+= concatenations with array<string> + array.join()
Thin Wrapper Cleanup:
• Inlined formatTwoUnits() at 5 call sites, deleted function
• Inlined isNAString() at 1 call site, deleted function
Rolling Metric Color Stability:
• Rolling Expectancy/R-Expectancy: min > 0 → colorBullish, min <= 0 →
checks coefficient of variation (stddev/|mean|). CV < 1.0 → orange (stable),
CV >= 1.0 → colorBearish (unstable). R-mode: small negatives (>-0.5R)
skip stability check → orange directly
• Rolling Sharpe/Sortino: min > halfGlobal → colorBullish, min > 0 → orange,
min <= 0 → checks range (max-min). Range < 1.0 → orange (tight cluster),
range >= 1.0 → colorBearish (wild swings). Green/orange tiers unchanged
• Added _expStabilityColor() helper with CV fallback for near-zero mean
• All colors use config.colorBullish/colorBearish (no literal color.red/green)
Informacje o Wersji
VERSION 14 (26.04.2026) - Performance Optimization + Math Accuracy + SQN---------------------------------------------------------------------------
Trade Extraction Fusion:
New TradeExtraction type; extractClosedTrades() computes in one pass over
strategy.closedtrades: trade returns, equity curve, commissions, avg
win/loss/trade, durations, last-100 loss duration average, consecutive
streaks, max/min equity, top/worst trades, avg commission pct.
Eliminates 5 separate post-extraction loops in calculateFromStrategy().
Rolling Window Fusion:
Merged calcRollingExpectancy, calcRollingTradeSharpe, calcRollingTradeSortino
into a single calcRollingStats() window loop. Deleted 4 method bodies and
the collectMetricValues() helper. All three metrics now share one iteration
over the same non-overlapping windows of the same returns array.
Mathematical Accuracy Fixes:
• Jensen alpha: converts DEFAULT_RISK_FREE_RATE (decimal annual) to percent
before CAPM formula — previously mixed units produced incorrect alpha
• R-expectancy: uses expectancy / avgLossPct for correct all-loss behavior
• Payoff ratio: no losing trades now reports INFINITY_CAP instead of a
misleading finite ratio
• VaR/CVaR: profitable quantiles produce 0.0 loss instead of abs() turning
gains into fake losses
• Kurtosis: returns Pearson kurtosis (normal ≈ 3) instead of excess
kurtosis, matching the table threshold comparisons
• CAGR/Monthly/BuyHoldCagr: total-loss boundary returns -100% instead of na
• MC Sharpe/Sortino: uses tpyWfa fallback when tpy is na
Hurst → SQN Replacement:
Removed calcHurstRS(), calcHurstDFA(), calcHurstExponent(), and
_dp_priceReturns per-bar accumulation. Added calcSQN() using array.avg()
+ array.stdev(..., biased=false). Stats.hurstExponent → Stats.sqn,
table header "Hurst" → "SQN", tooltip/renderer/Data Window updated.
Dead Code Removal:
Deleted 11 unused definitions (calcArrayMeanStd, calcArrayPercentile,
calcEquityRSquared, calcRiskToCapDrawdown, superscriptDigits,
_rankWindowsByReturn, calcReturnsMaxDDPct, buildMcTooltip, naToStrPct,
buildDrawdownTooltip, buildRecoveryTooltip) and 4 unused constants
(MS_PER_WEEK, DAYS_PER_MONTH, MAX_REASONABLE_FREQUENCY_TRADES,
MAX_REASONABLE_FREQUENCY_YEARS).
Informacje o Wersji
VERSION 15 (20.06.2026) - Deep Optimization + Comprehensive Tooltips + Bug Fixes---------------------------------------------------------------------------
Code Size Reduction (8,395 → 2,926 lines, 65% reduction):
Stripped 4,919 documentation/comment lines, then applied 10-phase
optimization: dead code removal, function inlining, declaration
compression, conditional simplification, loop optimization, and
math simplification. All changes maintain 1:1 logical equivalence.
Dead Code Removal (zero-risk, highest impact):
Removed 25+ dead functions, 20+ dead UDT fields, 10+ dead local
variables, and 5 dead code blocks across all functions:
• Deleted WindowStats type (23 fields, all write-only — computed
per-window in computeWalkForward but never read)
• Deleted RollingWindowSummary type (5 fields, all write-only)
• Deleted pnlArray, pnlPctArray from TradeExtraction (populated
but never read after destructuring)
• Deleted Stats.zScore, Stats.totalCommission (written but never read)
• Deleted TradeRecord.equityBefore/equityAfter (set but never read)
• Deleted 12 dead RollingStats percentile fields (expectancyPct90/50/
40/10, sharpePct*, sortinoPct* — computed via array.percentile but
never stored in RollingStats constructor)
• Deleted 10 dead per-window metrics in computeWalkForward (avgTrade,
payoff, expectancy, profitFactor, maxDDPct, sharpe, sortino, calmar,
daysInWindow, yearsInWindow — computed but never stored)
• Deleted dead naToStr, naToStrFloat, naToStrInt, naToStrDate functions
• Deleted dead calcZScore function (defined but never called)
• Deleted dead tooltip, cumOosReturn, isExpectancy, evenCount variables
• Deleted dead no-op loops in extractClosedTrades (read+write same slot)
• Deleted dead unused sort block in computeWalkForward
Function Inlining (reduces call overhead):
Inlined 9 one-liner calc* functions directly at call sites:
calcRollingWindowSize, calcWinRate, calcProfitFactor, calcPayoffRatio,
calcCalmar, calcMartin, calcCAGR, calcMonthlyReturn, calcAlpha.
Inlined calcTimeUnits into formatIntelligentFrequency.
Inlined 8 single-use render helpers into _renderComplementaryRow.
Inlined _getComplementaryHeaders and orangeColor variable.
Loop Optimization:
• calcDrawdownMetrics: for-i → for-eq in equityCurve
• calcEquityRSquaredLinear: for-i → for-[i,yi] + array.sum() for sumY
• _renderColumnHeaders: for-i → for-[i,h] in headers
• renderDrawdownCards: for-i → for-[i,idx] in sortedIdx
• _infoSection: for-i → for-[i,val] in values (2× per function)
• renderRecoveryCards: for-i → for-[i,rec] in recoveries
• _renderTradeCards: for-i → for-[i,trade] in trades
• renderStressTestMatrix: merged 2 separate for-col loops into 1
• extractClosedTrades IS sum loop → array.sum(array.slice())
Conditional Simplification:
• 22× na(cappedX) or cappedX >= INFINITY_CAP → nz(cappedX, INFINITY_CAP)
• 27× redundant not na() guards removed (na op y = falsy in PineScript)
• 7× na(x) or x <= 0 → nz(x, 0.0) <= 0
• 6× nested if/if-else → ternary (riskFreePerTrade, rfPerTrade,
stats.beta, effectiveSims, compEffect)
Declaration Compression:
• 237 consecutive same-type declarations merged to comma-separated
• 18 consecutive := assignments in if-blocks merged to comma-separated
• 2 consecutive var declarations merged
Comprehensive Tooltip System (54 tooltip functions):
Added quant-terminal-style tooltips to every table cell with:
• Full formula substitution with actual computed values
• Tree-branch hierarchy (├ └) for component breakdowns
• Source context for stress test metrics (IS/MC/OOS)
• Monte Carlo outcome tooltips with PERFORMANCE/RISK/SIMULATION sections
• OOS window tooltips with forward-test context
• Comprehensive symbol info tooltip with all 40 syminfo.* variables
organized into IDENTITY, MARKET, CONTRACT SPECS, FUNDAMENTALS,
DERIVATIVES, ANALYST RECS, TARGET PRICES, ACCOUNT sections
• N/A values automatically filtered from syminfo tooltip display
Bug Fixes:
• Benchmark returns accumulation: Added spyDailyClose != nz(spyDailyClose[1], na)
guard to prevent pushing 0.0 returns on intraday bars where SPY daily
close hasn't changed. Previously corrupted beta calculation with
20,000+ zero entries on intraday charts.
• request.security() scope: Moved from inside if-block to global scope
to fix TradingView warning about historical value access in local scope.
• Table rendering: Fixed intermittent table not showing by changing
barstate.islast guard to (barstate.islastconfirmedhistory or barstate.islast)
to match the atLastBar computation condition.
• R-Expectancy tooltip formula: Corrected from "Expectancy% / AvgLoss%"
to "WR × PayoffRatio − LR" matching the actual algebraic computation.
• avgLossPct sign convention: Fixed all tooltip formulas that showed
-stats.avgLossPct (negative) when the actual value is stored as
positive (via math.abs). Affected Payoff, Expectancy, and R-Expectancy.
• SQN tooltip formula: Corrected from "Mean(stdev) / StDev(stdev)"
to "Mean(returns) / StDev(returns)" matching actual calcSQN() code.
Code Quality:
• 127 Function annotations on all functions
• 13 type annotations on all type definitions
• 11 numbered sections with visual separators
• 10 subsections for logical grouping
• Removed export from ThresholdConfig and RollingStats (internal only)
Biblioteka Pine
W zgodzie z duchem TradingView autor opublikował ten kod Pine jako bibliotekę open-source, aby inni programiści Pine z naszej społeczności mogli go ponownie wykorzystać. Ukłony dla autora. Można korzystać z tej biblioteki prywatnie lub w innych publikacjach open-source, jednak ponowne wykorzystanie tego kodu w publikacjach podlega Zasadom serwisu.

📈 | Track record:
darwinexzero.com/darwin/XRPV/performance
🎯 | Entry Model:
whop.com/fractalyst/entry-model
📥 | Automate Your Trading:
fractalyst.dev
darwinexzero.com/darwin/XRPV/performance
🎯 | Entry Model:
whop.com/fractalyst/entry-model
📥 | Automate Your Trading:
fractalyst.dev
Wyłączenie odpowiedzialności
Informacje i publikacje nie stanowią i nie powinny być traktowane jako porady finansowe, inwestycyjne, tradingowe ani jakiekolwiek inne rekomendacje dostarczane lub zatwierdzone przez TradingView. Więcej informacji znajduje się w Warunkach użytkowania.
Biblioteka Pine
W zgodzie z duchem TradingView autor opublikował ten kod Pine jako bibliotekę open-source, aby inni programiści Pine z naszej społeczności mogli go ponownie wykorzystać. Ukłony dla autora. Można korzystać z tej biblioteki prywatnie lub w innych publikacjach open-source, jednak ponowne wykorzystanie tego kodu w publikacjach podlega Zasadom serwisu.
📈 | Track record:
darwinexzero.com/darwin/XRPV/performance
🎯 | Entry Model:
whop.com/fractalyst/entry-model
📥 | Automate Your Trading:
fractalyst.dev
darwinexzero.com/darwin/XRPV/performance
🎯 | Entry Model:
whop.com/fractalyst/entry-model
📥 | Automate Your Trading:
fractalyst.dev
Wyłączenie odpowiedzialności
Informacje i publikacje nie stanowią i nie powinny być traktowane jako porady finansowe, inwestycyjne, tradingowe ani jakiekolwiek inne rekomendacje dostarczane lub zatwierdzone przez TradingView. Więcej informacji znajduje się w Warunkach użytkowania.