Reversal Trap Probability Bands [BigBeluga]
More exclusive indicators from BigBeluga
Subscribe to BigBeluga Premium for $66.47/month to get exclusive indicators by this author. You pay right on TradingView and can use them on your charts straight away.
Explore BigBeluga Premium🔵 OVERVIEW
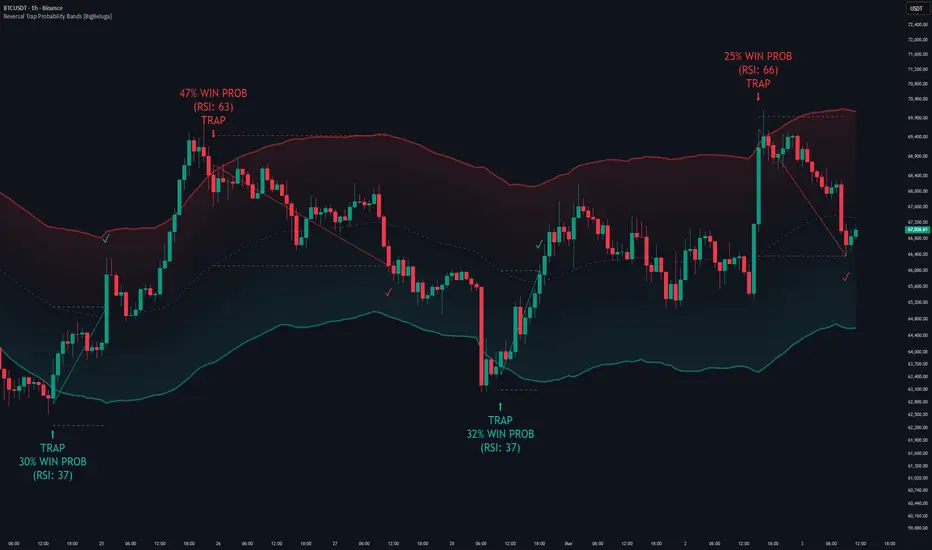
The Reversal Trap Probability Bands is an advanced technical indicator created by BigBeluga to identify and trade fakeout traps around market extremes. Traditional envelope or band indicators often fail because traders blindly enter breakouts that quickly reverse into whipsaw losses. In order to provide a solution to this problem, this indicator combines volatility-based envelope channels with a dynamic probability tracking engine, measuring historical RSI buckets to calculate real-time win probabilities for reversal traps.
The indicator aims to visualize institutional exhaustion and subsequent mean-reversion expansions. The core element of its calculation involves tracking baseline moving averages alongside outer volatility bounds defined as:
upper_band = basis + (multiplier * vola)
lower_band = basis - (multiplier * vola)
where basis is an exponential moving average of length envelope_len, and vola is the ATR volatility measure scaled by multiplier. Higher values of envelope_len and multiplier allow the indicator to filter out routine market noise and isolate major structural exhaustion points.
🔵 FEATURES
The system utilizes a multi-layered matrix structure to provide actionable market intelligence:
1 — Volatility Envelope & Basis Engine
2 — Reversal Trap Detection & RSI Probability Tracking
3 — Dynamic Target, Stop, & Signal Management
🔵 HOW TO USE
Apart from the basic visualization of volatility extremes, this tool can also act in alternative ways to support decision-making:
🔵 NOTES
Why this implementation is unique:
The Reversal Trap Probability Bands is an advanced technical indicator created by BigBeluga to identify and trade fakeout traps around market extremes. Traditional envelope or band indicators often fail because traders blindly enter breakouts that quickly reverse into whipsaw losses. In order to provide a solution to this problem, this indicator combines volatility-based envelope channels with a dynamic probability tracking engine, measuring historical RSI buckets to calculate real-time win probabilities for reversal traps.
The indicator aims to visualize institutional exhaustion and subsequent mean-reversion expansions. The core element of its calculation involves tracking baseline moving averages alongside outer volatility bounds defined as:
upper_band = basis + (multiplier * vola)
lower_band = basis - (multiplier * vola)
where basis is an exponential moving average of length envelope_len, and vola is the ATR volatility measure scaled by multiplier. Higher values of envelope_len and multiplier allow the indicator to filter out routine market noise and isolate major structural exhaustion points.
🔵 FEATURES
The system utilizes a multi-layered matrix structure to provide actionable market intelligence:
1 — Volatility Envelope & Basis Engine
- envelope_len = input.int(55, "Envelope Smoothness"): Controls the responsiveness and smoothness of the central baseline.
- upper_band & lower_band: Dynamic outer boundaries that shade gradient fills to visualize upper and lower market extremes.
2 — Reversal Trap Detection & RSI Probability Tracking
- trap_window = input.int(10, "Trap Window (Candles)"): Defines the maximum candle count allowed outside the bands before invalidating a fakeout setup.
- rsi_bucket = math.max(0, math.min(10, math.round(rsi / 10))): Automatically categorizes momentum into distinct RSI tiers to calculate real-time win probability rates.
3 — Dynamic Target, Stop, & Signal Management
- Bull_Stop = ta.lowest(low, 2) - atr & Bear_Stop = ta.highest(high, 2) + atr: Calculates volatility-adjusted safety padding for active trade management.
- Signal Labels & Targets: Plots clear entry notifications displaying win probability percentages, along with dashed target and stop lines.
🔵 HOW TO USE
Apart from the basic visualization of volatility extremes, this tool can also act in alternative ways to support decision-making:
- Identify Reversal Traps: Wait for price to break outside the upper or lower envelope boundaries and subsequently close back inside within the defined trap_window.
* Evaluate Win Probability: Check the probability percentage displayed on the trap signal label (backed by historical RSI bucket tracking) before entering a trade.
* Manage Risk with Stops and Targets: Use the projected dashed target lines (anchored to the basis line) and ATR-padded stop lines to execute and protect positions.
🔵 NOTES
Why this implementation is unique:
- It moves beyond static band indicators by integrating a self-learning historical database that calculates live win probabilities based on momentum buckets.
- The automated target and stop-loss line projection engine provides clear visual roadmaps for every triggered setup.
- The script is fully optimized for Pine Script version 6, utilizing high-performance array tracking (`var int[] bull_total = array.new_int(11, 0)`) for smooth execution.
- Note: Because the win probability engine evaluates historical trade performance dynamically in real time, initial signals on a freshly loaded chart may display "Tracking..." until sufficient sample data is recorded.

🌐 bigbeluga.org/tv - Get access to our powerful tools & indicators.
🔵 Learn More -> docs.bigbeluga.org/
🔵 Join Discord -> go.bigbeluga.org/k65q9bfqfu
All content provided by BigBeluga is for educational purposes only
🔵 Learn More -> docs.bigbeluga.org/
🔵 Join Discord -> go.bigbeluga.org/k65q9bfqfu
All content provided by BigBeluga is for educational purposes only
Wyłączenie odpowiedzialności
Informacje i publikacje nie stanowią i nie powinny być traktowane jako porady finansowe, inwestycyjne, tradingowe ani jakiekolwiek inne rekomendacje dostarczane lub zatwierdzone przez TradingView. Więcej informacji znajduje się w Warunkach użytkowania.
🌐 bigbeluga.org/tv - Get access to our powerful tools & indicators.
🔵 Learn More -> docs.bigbeluga.org/
🔵 Join Discord -> go.bigbeluga.org/k65q9bfqfu
All content provided by BigBeluga is for educational purposes only
🔵 Learn More -> docs.bigbeluga.org/
🔵 Join Discord -> go.bigbeluga.org/k65q9bfqfu
All content provided by BigBeluga is for educational purposes only
Wyłączenie odpowiedzialności
Informacje i publikacje nie stanowią i nie powinny być traktowane jako porady finansowe, inwestycyjne, tradingowe ani jakiekolwiek inne rekomendacje dostarczane lub zatwierdzone przez TradingView. Więcej informacji znajduje się w Warunkach użytkowania.