OPEN-SOURCE SCRIPT
QRC Institutional Regression Channel [CLEVER]
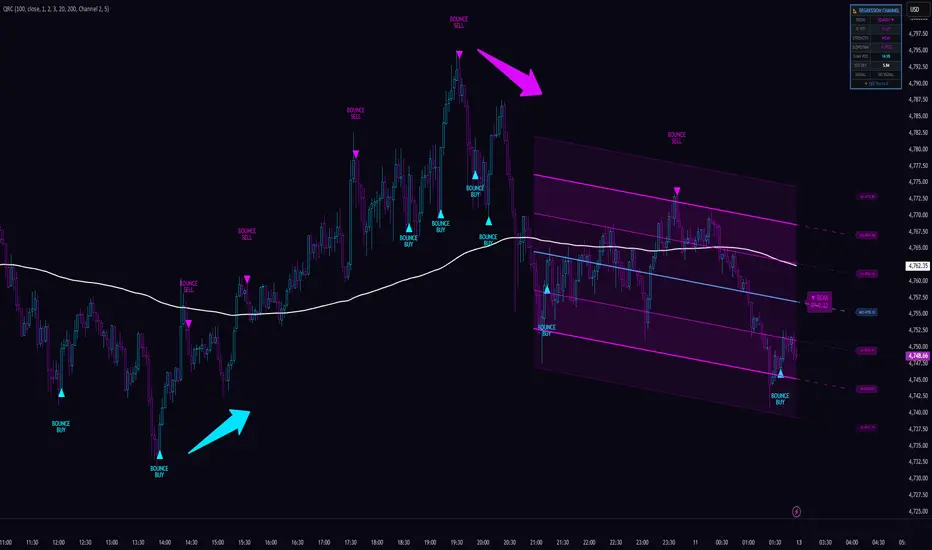
QRC Institutional Regression Channel [CLEVER]
📌 Overview
QRC Institutional Regression Channel [CLEVER] is a statistically driven technical analysis tool built on linear regression methodology. Its primary objective is to present price action within a structured mathematical framework, allowing traders to objectively assess trend direction, volatility range, and deviation extremes. The indicator calculates a regression line using historical price data and plots multiple standard deviation (sigma) bands around it to visualize relative market expansion and contraction.
This tool is designed to support discretionary decision-making. It is not an automated trading system, investment advisory service, or guaranteed signal provider. All calculations are based strictly on completed bars (bar close), and the script does not use future-looking data. Signals and visual outputs are derived solely from historical price inputs.
The regression slope reflects directional bias, while the R² value quantifies the statistical consistency of the current trend. Standard deviation bands represent probabilistic boundaries where price has historically deviated from its regression mean. These levels should be interpreted as contextual reference zones rather than predictive certainty levels.
The purpose of this indicator is not to replace trader judgment, but to provide a systematic and repeatable analytical structure. It is most effective when used alongside additional confluence factors such as market structure analysis, liquidity zones, volume behavior, or higher-timeframe context.
Trading and investing involve risk. Past performance does not guarantee future results. Users should conduct independent analysis and apply proper risk management before making financial decisions.
📐 Core Concept
The core foundation of QRC Institutional Regression Channel [CLEVER] is based on linear regression analysis, a statistical method used to model the relationship between price and time over a defined lookback period. Instead of relying on subjective trendlines or manually drawn channels, this indicator calculates a best-fit regression line using historical price data. This line represents the average directional path of price within the selected period.
The regression slope determines the directional bias of the market during that lookback window. A positive slope reflects upward directional pressure, while a negative slope reflects downward pressure. The steepness of the slope provides insight into the relative strength of that movement. However, slope direction alone should not be interpreted as a standalone trading signal; it is a structural measurement of historical price behavior.
To complement the regression line, the indicator calculates standard deviation bands (commonly 1σ, 2σ, and 3σ). These bands measure how far price deviates from its regression mean based on historical volatility within the same lookback range. Standard deviation is a statistical dispersion metric — it does not predict reversals, but instead defines probabilistic boundaries where price has historically stretched relative to its average path.
An additional statistical component, R² (coefficient of determination), is used to quantify how well price movement fits the regression model. A higher R² value suggests that price has been moving in a relatively structured and consistent manner during the selected period. A lower R² value suggests less structural consistency and potentially more noise. This metric is descriptive, not predictive.
The combined interaction between slope, deviation bands, and R² creates a structured analytical framework. The regression midline represents equilibrium, while outer deviation bands represent statistically extended conditions. These zones provide contextual reference points rather than guaranteed turning points.
Importantly, all calculations are derived strictly from historical price data and confirmed on bar close. The indicator does not access future data and does not rely on repainting logic. It is designed as a quantitative visualization tool that supports discretionary analysis, not as a predictive or automated trading system.
Because financial markets are influenced by numerous dynamic variables, no statistical model can eliminate uncertainty. The regression framework should therefore be used as part of a broader analytical process that includes risk management and additional confluence factors.
🎯 Key Features
Multi-Sigma Regression Bands
The indicator plots multiple standard deviation (sigma) bands around the regression midline, typically including 1σ, 2σ, and 3σ levels. These bands visually represent how far price has deviated from its statistical mean within the selected lookback period. Instead of labeling these areas as guaranteed reversal zones, they should be interpreted as probabilistic stretch boundaries. When price approaches outer bands, it reflects historically extended conditions relative to the regression average — not certainty of reversal, but measurable deviation.
Dynamic Regression Midline
At the center of the channel is the regression mean line, which represents the statistically calculated equilibrium path of price. This midline adapts automatically as new historical data becomes available. It can serve as a reference point for balance, trend continuation assessment, or mean interaction analysis. The midline is descriptive of historical structure and should not be treated as a fixed support or resistance level.
Slope-Based Directional Bias
The regression slope continuously measures directional pressure over the defined lookback window. A positive slope indicates upward bias within that historical segment, while a negative slope reflects downward bias. The rate of change in slope can provide insight into momentum shifts. However, slope direction is a contextual metric, not a buy or sell command.
R² Trend Strength Measurement
The inclusion of the R² (coefficient of determination) metric allows users to evaluate how closely price movement fits the regression model. Higher R² values indicate stronger structural alignment with the calculated trend path, while lower values suggest increased variability or noise. This feature enhances structural awareness but does not forecast future outcomes.
Channel Position Percentage
The indicator may calculate the relative position of price within the regression channel as a percentage. This helps traders understand whether price is trading near equilibrium, moderately extended, or statistically stretched. It is intended for context and comparison rather than prediction.
Configurable Bounce Logic (Optional)
Optional bounce detection logic can highlight instances where price reacts near selected deviation levels. These signals are confirmed on bar close and are based strictly on historical data inputs. They are not forward-looking and should be treated as contextual alerts rather than guaranteed trade opportunities.
Customizable Lookback and Volatility Settings
Users can adjust regression length and deviation multipliers to suit different market environments or timeframes. A shorter lookback period may respond more quickly to recent changes, while a longer period may emphasize broader structure. These settings allow flexibility without altering the core statistical foundation.
Visual Dashboard and Data Panel
An integrated dashboard can display structured information such as slope value, R² strength, channel position, and general directional bias. This feature is designed to provide quick situational awareness without requiring manual recalculation.
Non-Repainting, Bar-Close Confirmed Calculations
All computations are derived strictly from historical price data and confirmed at bar close. The script does not use future-looking inputs. Once a bar is closed, its calculated values remain fixed according to the defined logic.
Overall, the key features of QRC are built to provide statistical structure, volatility awareness, and trend context. They are analytical tools intended to assist discretionary decision-making — not guarantees, financial advice, or automated trading instructions.
⚙️ How It Works
QRC Institutional Regression Channel [CLEVER] operates by applying a statistical linear regression model to a defined lookback period of historical price data. The process begins by selecting a user-defined number of past bars. Within that fixed window, the indicator calculates a best-fit regression line using mathematical least-squares methodology. This line represents the average directional path price has followed during that specific period.
1️⃣ Regression Line Calculation
The regression line is computed by minimizing the distance between historical price points and the estimated trend path. The result is a dynamic mean line that adjusts only when a new bar closes. As older data rolls out of the lookback window and new data is added, the regression line recalibrates accordingly.
This recalculation is descriptive of past price behavior within the selected range. It does not forecast future movement; it simply models the statistical trend of the most recent historical segment.
2️⃣ Slope & Directional Bias
Once the regression line is calculated, its slope is derived. The slope reflects whether the historical trend within the lookback period has been upward, downward, or relatively neutral. A steeper slope suggests stronger directional pressure during that segment, while a flatter slope indicates consolidation or slower movement.
This measurement provides structural context but does not function as a standalone entry or exit signal.
3️⃣ Standard Deviation Bands
After the regression mean is established, the indicator calculates the standard deviation of price relative to that mean. Standard deviation measures how dispersed price has been around its average path.
Using this value, the script plots multiple sigma bands (such as 1σ, 2σ, and 3σ). These bands form dynamic channel boundaries that expand or contract depending on recent volatility. When volatility increases, the channel widens; when volatility decreases, the channel narrows.
These bands define probabilistic deviation zones — not guaranteed reversal levels. They highlight how stretched price is relative to its recent historical norm.
4️⃣ R² Trend Consistency Measurement
The indicator also calculates the R² (coefficient of determination), which measures how closely price movement aligns with the regression model. A higher R² indicates that price has followed a more structured and consistent path within the selected window. A lower R² suggests more irregular or noisy movement.
This metric enhances analytical clarity but does not predict continuation or reversal.
5️⃣ Bar-Close Confirmation & Data Integrity
All computations are based strictly on historical price data and are confirmed at bar close. The script does not access future bars and does not use forward-looking calculations. Once a candle closes, the calculated values for that bar remain fixed according to the defined logic.
Because the regression window shifts forward as new data arrives, values may adjust on the current developing bar — but closed-bar calculations remain stable.
6️⃣ Continuous Adaptation
As each new bar completes, the indicator updates the regression model by dropping the oldest bar in the lookback period and incorporating the newest one. This rolling-window mechanism allows the channel to adapt dynamically to changing market conditions while remaining statistically grounded in recent data.
⚠️ Important Consideration
The indicator models historical price behavior using statistical tools. It does not predict future price movement, guarantee reversals, or eliminate risk. Financial markets are influenced by multiple dynamic variables beyond any single mathematical framework.
For this reason, QRC should be used as part of a broader analytical process that includes independent judgment, additional confluence tools, and proper risk management.
📊 How to Use QRC Institutional Regression Channel [CLEVER]
QRC Institutional Regression Channel [CLEVER] is designed as a structured analytical tool to help traders understand trend direction, volatility expansion, and statistically stretched price conditions. It should be used as a context and confirmation framework, not as a standalone trading system.
1️⃣ Understanding Market Context (Trend Identification)
The first step in using QRC is identifying the overall market structure through the regression slope and channel alignment.
When the regression slope is positive, it indicates that the historical price path within the lookback period is biased to the upside. When it is negative, it reflects downside bias. However, this should not be treated as a direct buy or sell signal — it is a structural context filter.
Traders typically use this information to align trades with the dominant directional environment rather than trading against it.
2️⃣ Using the Regression Midline as Equilibrium Reference
The midline (regression mean) acts as a dynamic equilibrium level. Price interaction with this midline can be used to understand whether the market is trading above or below its statistical average.
Price above midline → bullish structural bias
Price below midline → bearish structural bias
Midline reactions should be interpreted as contextual balance shifts, not fixed support or resistance zones.
3️⃣ Identifying Volatility Extremes (Sigma Bands)
The standard deviation bands (1σ, 2σ, 3σ) are used to identify statistically extended market conditions.
When price moves toward outer bands, it indicates that price has deviated significantly from its regression mean based on recent volatility. These zones are useful for understanding potential exhaustion or expansion phases.
However, these levels are not reversal guarantees. They should be used as probabilistic stretch areas where price is less statistically “normal” relative to its recent behavior.
4️⃣ Bounce and Reaction Observation (Optional Signals)
If bounce logic is enabled, the indicator highlights price reactions near selected deviation zones.
Lower band reactions may indicate potential bullish rejection behavior
Upper band reactions may indicate potential bearish rejection behavior
These signals are confirmed only after bar close and should be treated as observational alerts, not automatic trade entries.
5️⃣ R² for Trade Quality Filtering
The R² value can be used as a filter for market structure quality.
High R² → cleaner, more structured trend environment
Low R² → choppy, noisy, or unstable conditions
Traders often prefer taking directional setups in higher R² environments because price behavior is more consistent with the regression model.
6️⃣ Channel Position for Timing Context
Channel position (%) shows where price currently sits within the regression structure.
Near lower zone → statistically discounted area
Near mid zone → equilibrium / balanced area
Near upper zone → statistically extended area
This helps in timing decisions rather than generating signals alone.
7️⃣ Multi-Timeframe Confirmation (Recommended Use)
QRC works best when combined with higher timeframe context. For example:
Higher timeframe trend direction can define bias
Lower timeframe QRC can refine entries and exits
This alignment increases analytical confidence but still does not eliminate risk.
⚠️ Risk & Usage Consideration
QRC is a statistical modeling tool, not a predictive system. It does not guarantee reversals, continuation, or profitable outcomes. Market conditions can change due to external factors beyond historical structure.
It should always be used with:
Proper risk management
Additional confirmation tools
Independent trading judgment
🏁 Final Note
The correct way to use QRC is as a market structure compass, not a signal generator. It helps traders understand where price is in relation to its statistical equilibrium, how strong the trend structure is, and whether current conditions are normal or extended relative to recent history.
⚙️ Settings & Customization (QRC Institutional Regression Channel [CLEVER])
The QRC Institutional Regression Channel [CLEVER] provides a flexible customization system that allows traders to adapt its behavior according to different market conditions, timeframes, and trading styles. All settings are designed to modify the sensitivity and visualization of the statistical model, while the core regression logic remains unchanged and mathematically consistent.
The most important setting is the Regression Length, which defines how many historical bars are used to calculate the regression line. A shorter length makes the indicator more responsive to recent price movements but can introduce more fluctuations and noise. A medium length offers a balanced structure suitable for most intraday and swing trading environments. A longer length smooths out short-term volatility and focuses on broader market structure, making it more stable but less reactive to sudden changes.
Another key customization area is the Deviation (Sigma) settings, which control the width of the channel bands around the regression midline. The 1σ band represents near-average volatility conditions, the 2σ band reflects moderate statistical extension, and the 3σ band highlights extreme deviation zones. Adjusting these values changes how tightly or widely price is framed within the channel. Narrower settings make price interactions more frequent, while wider settings emphasize only significant volatility extremes.
The Bounce Zone selection allows users to choose which deviation level is used for reaction-based signal logic. Selecting inner bands results in more frequent but weaker reactions, while outer bands focus on less frequent but more statistically significant price extremes. This setting is purely observational and does not guarantee reversals, but it helps define which part of the channel is being monitored for price interaction.
The Signal Cooldown setting controls how often signals can appear after a valid condition has triggered. A lower cooldown produces more frequent signals, which may increase noise, while a higher cooldown reduces signal frequency and helps filter repetitive or clustered alerts during choppy market conditions.
An optional EMA filter can also be enabled to provide additional directional context. When price is above the EMA, the broader environment is considered bullish, and when price is below it, the environment is considered bearish. This does not affect regression calculations but helps traders align signals with higher-level trend direction.
In addition to analytical settings, the indicator includes several visual customization options. Users can toggle regression channels, fills, midline, slope arrows, R² display, signal markers, and dashboard visibility. This allows the interface to be simplified for clean charting or expanded into a full analytical dashboard depending on user preference.
Overall, the customization system is designed to help traders adapt the same statistical model to different trading strategies such as scalping, intraday trading, or swing trading. However, these settings only influence visualization and sensitivity, not predictive capability. The indicator remains a historical, data-driven regression tool that should be used with proper risk management and additional confirmation methods.
⚠️ Important Notes (QRC Institutional Regression Channel [CLEVER])
The QRC Institutional Regression Channel [CLEVER] is a statistical analysis tool designed to visualize market structure using historical price data. It is important to understand that all outputs generated by this indicator are based on past market behavior and mathematical calculations, not future price prediction.
This indicator does not guarantee any specific market outcome, trade result, or reversal point. The regression channel, slope, deviation bands, and R² values are descriptive in nature and should be interpreted as contextual information about how price has behaved within a defined lookback period. They represent probabilities and structure, not certainties.
Signals generated by the indicator, including bounce reactions or channel interactions, are strictly based on historical conditions and are confirmed only after bar close. These signals should not be treated as financial advice or direct buy/sell recommendations. Market conditions can change rapidly due to external factors that are not reflected in the statistical model.
Because the indicator relies on a fixed historical window, its structure continuously adapts as new data replaces old data. This means readings may change over time as the market evolves, especially in lower timeframes where volatility is higher.
Users are strongly advised to combine this tool with additional confirmation methods such as market structure analysis, risk management strategies, volume behavior, or higher timeframe bias. No single indicator should be used in isolation to make trading decisions.
Trading and investing in financial markets involves significant risk, and losses may occur. Past performance does not guarantee future results. The responsibility for all trading decisions lies entirely with the user.
⚠️ Disclaimer (QRC Institutional Regression Channel [CLEVER])
The QRC Institutional Regression Channel [CLEVER] is a technical analysis tool developed for educational and informational purposes only. It is designed to help users analyze market structure using statistical regression methods, including trend direction, volatility bands, and deviation-based measurements.
This indicator does not provide financial advice, investment recommendations, or trading signals that guarantee any specific outcome. All calculations and visual outputs are based on historical price data and mathematical formulas, and they should be interpreted strictly as analytical references rather than predictive assurances.
Trading and investing in financial markets involve substantial risk, and there is always a possibility of financial loss. Users should not rely solely on this indicator to make trading decisions. Instead, it should be used as part of a broader analytical approach that includes independent research, risk management, and additional confirmation tools.
Past performance, statistical readings, or historical behavior displayed by the indicator do not guarantee future results. Market conditions can change rapidly due to external factors that are not captured by any single technical model.
By using this indicator, the user acknowledges full responsibility for all trading decisions and accepts that the creator of this tool is not liable for any financial losses or outcomes resulting from its use.
Skrypt open-source
W zgodzie z duchem TradingView twórca tego skryptu udostępnił go jako open-source, aby użytkownicy mogli przejrzeć i zweryfikować jego działanie. Ukłony dla autora. Korzystanie jest bezpłatne, jednak ponowna publikacja kodu podlega naszym Zasadom serwisu.

Wyłączenie odpowiedzialności
Informacje i publikacje nie stanowią i nie powinny być traktowane jako porady finansowe, inwestycyjne, tradingowe ani jakiekolwiek inne rekomendacje dostarczane lub zatwierdzone przez TradingView. Więcej informacji znajduje się w Warunkach użytkowania.
Skrypt open-source
W zgodzie z duchem TradingView twórca tego skryptu udostępnił go jako open-source, aby użytkownicy mogli przejrzeć i zweryfikować jego działanie. Ukłony dla autora. Korzystanie jest bezpłatne, jednak ponowna publikacja kodu podlega naszym Zasadom serwisu.
Wyłączenie odpowiedzialności
Informacje i publikacje nie stanowią i nie powinny być traktowane jako porady finansowe, inwestycyjne, tradingowe ani jakiekolwiek inne rekomendacje dostarczane lub zatwierdzone przez TradingView. Więcej informacji znajduje się w Warunkach użytkowania.