Trend Regime Meter [Indicatr]
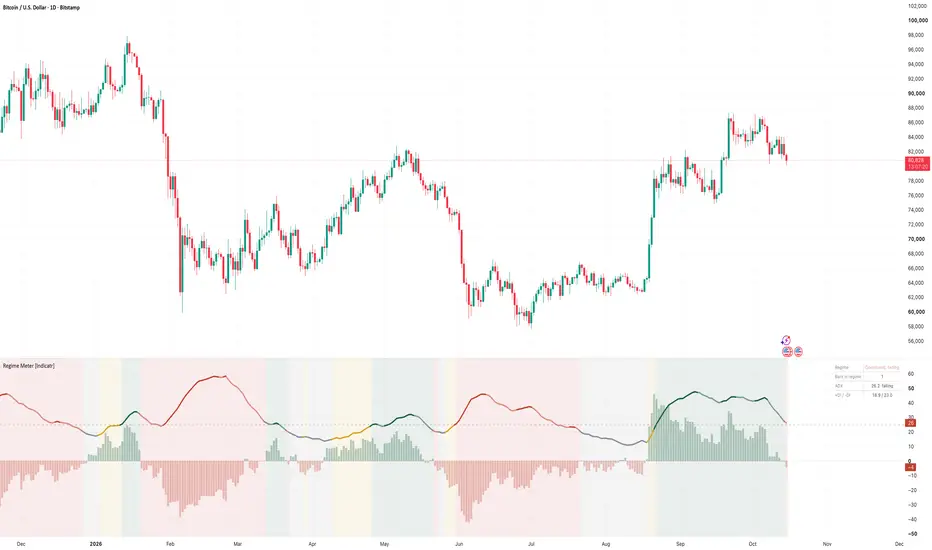
Trend Regime Meter turns ADX and the directional indicators into one clear state: uptrend, downtrend, range, trend building or trend fading. It fixes the most common misreading of ADX - a high ADX says that a trend is strong, not in which direction.
WHAT IT DOES
ADX measures trend strength, +DI and -DI show direction, and many traders struggle to combine the three lines. This script classifies every bar into a regime, colours the ADX line accordingly and shows the current state in a table. It can be used on its own or as a filter for other tools.
HOW IT WORKS
HOW TO USE
THE CHART
Daily chart. The ADX line is coloured by regime: green = uptrend, red = downtrend, light = fading, amber = building, grey = range. The histogram shows the DI spread (+DI minus -DI). Dashed and dotted lines mark the trend-on (25) and trend-off (20) levels. The table shows the current regime, how many bars it has lasted, ADX with its slope and both DI values.
WHAT IS ORIGINAL
The built-in ADX and DMI show raw lines. This script adds a state model with hysteresis, a DI dead band, separate building and fading states, and a regime table - so the three lines become one readable answer.
CREDITS
ADX, +DI and -DI were developed by J. Welles Wilder (New Concepts in Technical Trading Systems, 1978). Standard formulas via the built-in ta.dmi function.
LIMITATIONS
Disclaimer
For educational and analytical purposes only. Not financial advice. Marks and signals are not buy or sell recommendations. Past behaviour does not guarantee future results.
WHAT IT DOES
ADX measures trend strength, +DI and -DI show direction, and many traders struggle to combine the three lines. This script classifies every bar into a regime, colours the ADX line accordingly and shows the current state in a table. It can be used on its own or as a filter for other tools.
HOW IT WORKS
- Direction: +DI above -DI = up, -DI above +DI = down. A minimum DI spread (default 2) is required to change direction, so small crossings do not flip the state.
- Trend on/off with hysteresis: a trend starts when ADX rises above 25 and only ends when ADX falls below 20. The gap between the two levels prevents constant switching around a single threshold.
- Strong vs. fading: inside a trend, a rising ADX means the trend is strengthening, a falling ADX means it is fading (lighter colour).
- Trend building: outside a trend, ADX rising above 15 marks a possible new trend (amber) with its likely direction.
- Range: everything else (grey).
HOW TO USE
- Uptrend or downtrend: context for trend-following setups in that direction - long or short.
- Range: crossovers and breakouts tend to be less reliable; mean-reversion tools are usually the better fit.
- Fading: the trend is losing strength. This does not mean it has reversed.
- Optional: colour the price bars by regime.
- Alerts: uptrend started, downtrend started, range started, trend building, trend fading, any regime change.
THE CHART
Daily chart. The ADX line is coloured by regime: green = uptrend, red = downtrend, light = fading, amber = building, grey = range. The histogram shows the DI spread (+DI minus -DI). Dashed and dotted lines mark the trend-on (25) and trend-off (20) levels. The table shows the current regime, how many bars it has lasted, ADX with its slope and both DI values.
WHAT IS ORIGINAL
The built-in ADX and DMI show raw lines. This script adds a state model with hysteresis, a DI dead band, separate building and fading states, and a regime table - so the three lines become one readable answer.
CREDITS
ADX, +DI and -DI were developed by J. Welles Wilder (New Concepts in Technical Trading Systems, 1978). Standard formulas via the built-in ta.dmi function.
LIMITATIONS
- ADX is a lagging indicator; regimes are confirmed after the move has started.
- Thresholds (25/20/15) are common defaults, not optimised values.
- The state on the current bar can change until the bar closes.
Disclaimer
For educational and analytical purposes only. Not financial advice. Marks and signals are not buy or sell recommendations. Past behaviour does not guarantee future results.

Indicatr - the indicators you know, rebuilt with market context: volume, trend and momentum, for long and short. Free open-source tools and Pro tools. Guides and setups: indicator.trading/en/link
Wyłączenie odpowiedzialności
Informacje i publikacje nie stanowią i nie powinny być traktowane jako porady finansowe, inwestycyjne, tradingowe ani jakiekolwiek inne rekomendacje dostarczane lub zatwierdzone przez TradingView. Więcej informacji znajduje się w Warunkach użytkowania.
Indicatr - the indicators you know, rebuilt with market context: volume, trend and momentum, for long and short. Free open-source tools and Pro tools. Guides and setups: indicator.trading/en/link
Wyłączenie odpowiedzialności
Informacje i publikacje nie stanowią i nie powinny być traktowane jako porady finansowe, inwestycyjne, tradingowe ani jakiekolwiek inne rekomendacje dostarczane lub zatwierdzone przez TradingView. Więcej informacji znajduje się w Warunkach użytkowania.