OPEN-SOURCE SCRIPT
Weekly 30 SMA + 30 EMA Ribbon + Spread SD
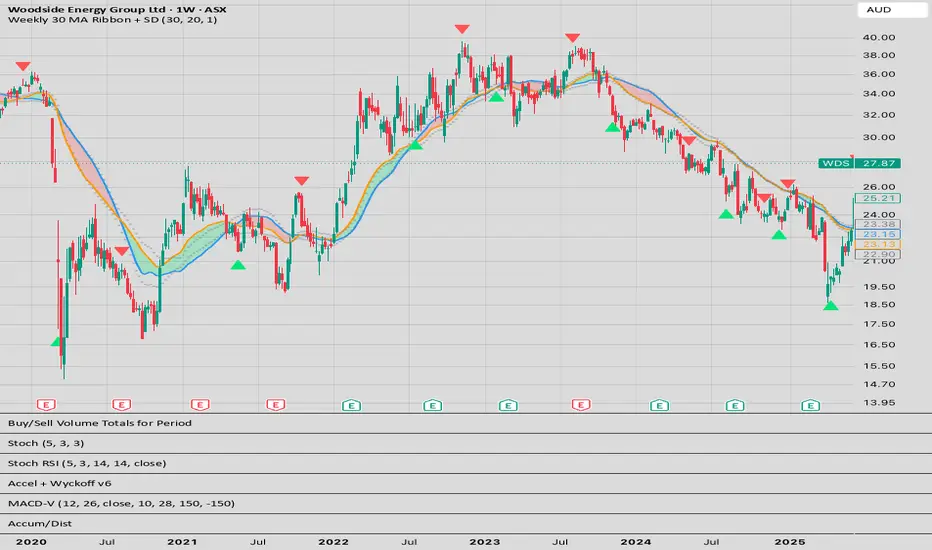
Description
Classic 30-week moving average ribbon (Stan Weinstein / Stage Analysis style) with added Spread + Standard Deviation bands for volatility awareness.
Key Features
True Weekly 30 SMA & 30 EMA (your 30-week MA)
Colored ribbon between the two MAs (Red when SMA > EMA, Green when EMA > SMA)
Spread ± Standard Deviation bands (default 20-period)
Visual cross markers
Works best on Daily or Weekly charts
How to Use
Best viewed on Daily or Weekly charts.
Green ribbon = EMA above SMA (bullish trend support in Stage 2 - RED FLAG indicators crossover).
Red ribbon = SMA above EMA (bearish or distribution - GREEN FLAG indicators crossover) - [I forgot to change the flag colours to match, you can do this adjustment yourself.]
Monitor how far the ribbon stretches relative to the SD bands — wide spreads often precede mean reversion or acceleration.
Adjust SD Length for more/less sensitivity (20 is balanced).
Pros
Directly implements the popular 30-week MA concept
SD bands add objective volatility context to traditional stage analysis
Excellent for identifying accumulation/distribution phases and trend strength
Clean and not over-cluttered
Cons / Limitations
Weekly data updates more slowly (less useful for very short-term trading)
Color scheme is intentionally swapped — users may need a short adjustment period
Like all MA tools, it lags price and works best in trending markets
Classic 30-week moving average ribbon (Stan Weinstein / Stage Analysis style) with added Spread + Standard Deviation bands for volatility awareness.
Key Features
True Weekly 30 SMA & 30 EMA (your 30-week MA)
Colored ribbon between the two MAs (Red when SMA > EMA, Green when EMA > SMA)
Spread ± Standard Deviation bands (default 20-period)
Visual cross markers
Works best on Daily or Weekly charts
How to Use
Best viewed on Daily or Weekly charts.
Green ribbon = EMA above SMA (bullish trend support in Stage 2 - RED FLAG indicators crossover).
Red ribbon = SMA above EMA (bearish or distribution - GREEN FLAG indicators crossover) - [I forgot to change the flag colours to match, you can do this adjustment yourself.]
Monitor how far the ribbon stretches relative to the SD bands — wide spreads often precede mean reversion or acceleration.
Adjust SD Length for more/less sensitivity (20 is balanced).
Pros
Directly implements the popular 30-week MA concept
SD bands add objective volatility context to traditional stage analysis
Excellent for identifying accumulation/distribution phases and trend strength
Clean and not over-cluttered
Cons / Limitations
Weekly data updates more slowly (less useful for very short-term trading)
Color scheme is intentionally swapped — users may need a short adjustment period
Like all MA tools, it lags price and works best in trending markets
Skrypt open-source
W zgodzie z duchem TradingView twórca tego skryptu udostępnił go jako open-source, aby użytkownicy mogli przejrzeć i zweryfikować jego działanie. Ukłony dla autora. Korzystanie jest bezpłatne, jednak ponowna publikacja kodu podlega naszym Zasadom serwisu.

Wyłączenie odpowiedzialności
Informacje i publikacje nie stanowią i nie powinny być traktowane jako porady finansowe, inwestycyjne, tradingowe ani jakiekolwiek inne rekomendacje dostarczane lub zatwierdzone przez TradingView. Więcej informacji znajduje się w Warunkach użytkowania.
Skrypt open-source
W zgodzie z duchem TradingView twórca tego skryptu udostępnił go jako open-source, aby użytkownicy mogli przejrzeć i zweryfikować jego działanie. Ukłony dla autora. Korzystanie jest bezpłatne, jednak ponowna publikacja kodu podlega naszym Zasadom serwisu.
Wyłączenie odpowiedzialności
Informacje i publikacje nie stanowią i nie powinny być traktowane jako porady finansowe, inwestycyjne, tradingowe ani jakiekolwiek inne rekomendacje dostarczane lub zatwierdzone przez TradingView. Więcej informacji znajduje się w Warunkach użytkowania.