OPEN-SOURCE SCRIPT
Zaktualizowano Close Momentum (Area)
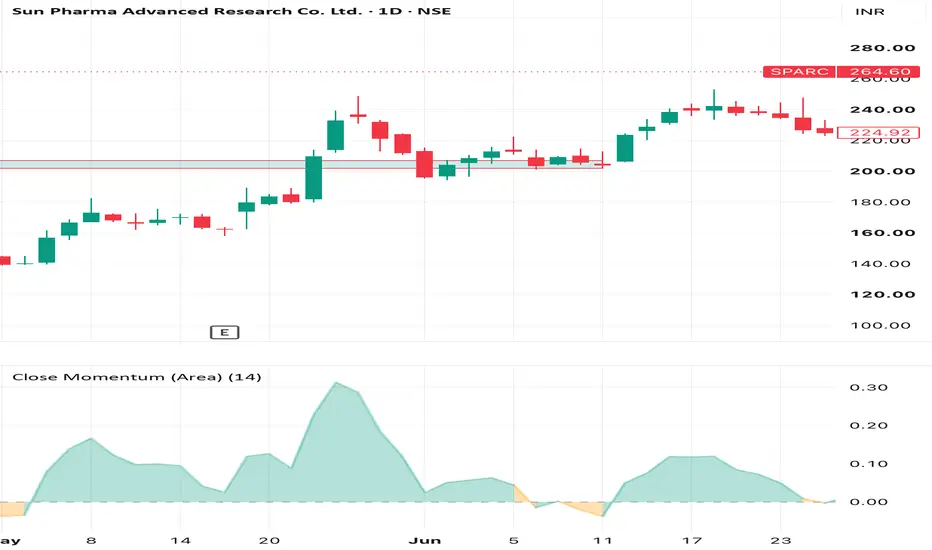
This indicator measures how today’s closing price compares to its own average over a user-defined lookback period (default: ~6 months). It helps you quickly see whether price is trading above or below its medium-term average in a single, easy-to-read pane.
Formula:
Momentum = Close ÷ Average Close (over N days)
• Momentum > 1 → Price is above its N-day average (bullish relative to medium-term mean).
• Momentum = 1 → Price equals its N-day average.
• Momentum < 1 → Price is below its N-day average (bearish relative to medium-term mean).
The result is plotted as a filled area anchored at the 1.0 line, making it easy tospot regimes where price is persistently strong (>1) or weak (<1).
Settings:
• Lookback days for average close – Number of bars used to calculate the average close.
• Default: 126 (≈ 6 months, assuming ~21 trading days/month).
• Adjust for shorter/longer horizons (e.g., 63 for ~3 months, 252 for ~1 year).
How traders can use it:
• Identify trend bias: sustained readings above 1 suggest an uptrend relative to the chosen period; below 1 suggests a downtrend.
• Spot mean-reversion setups: extremes far from 1 may indicate overextended moves.
• Combine with price action or other indicators to filter entries and confirm momentum shifts.
This is a simple, visual way to track medium-term price momentum without cluttering your main chart.
Formula:
Momentum = Close ÷ Average Close (over N days)
• Momentum > 1 → Price is above its N-day average (bullish relative to medium-term mean).
• Momentum = 1 → Price equals its N-day average.
• Momentum < 1 → Price is below its N-day average (bearish relative to medium-term mean).
The result is plotted as a filled area anchored at the 1.0 line, making it easy tospot regimes where price is persistently strong (>1) or weak (<1).
Settings:
• Lookback days for average close – Number of bars used to calculate the average close.
• Default: 126 (≈ 6 months, assuming ~21 trading days/month).
• Adjust for shorter/longer horizons (e.g., 63 for ~3 months, 252 for ~1 year).
How traders can use it:
• Identify trend bias: sustained readings above 1 suggest an uptrend relative to the chosen period; below 1 suggests a downtrend.
• Spot mean-reversion setups: extremes far from 1 may indicate overextended moves.
• Combine with price action or other indicators to filter entries and confirm momentum shifts.
This is a simple, visual way to track medium-term price momentum without cluttering your main chart.
Informacje o Wersji
• momentum itself is centered around 1.0, so plotting it with area style makes TradingView fill the space between 1 and the value.• By plotting delta = momentum - 1.0 , the baseline becomes 0, so the filled area is centered properly and no longer occupies the full band from 1 to 0.
Informacje o Wersji
changed the nameSkrypt open-source
W zgodzie z duchem TradingView twórca tego skryptu udostępnił go jako open-source, aby użytkownicy mogli przejrzeć i zweryfikować jego działanie. Ukłony dla autora. Korzystanie jest bezpłatne, jednak ponowna publikacja kodu podlega naszym Zasadom serwisu.

Wyłączenie odpowiedzialności
Informacje i publikacje nie stanowią i nie powinny być traktowane jako porady finansowe, inwestycyjne, tradingowe ani jakiekolwiek inne rekomendacje dostarczane lub zatwierdzone przez TradingView. Więcej informacji znajduje się w Warunkach użytkowania.
Skrypt open-source
W zgodzie z duchem TradingView twórca tego skryptu udostępnił go jako open-source, aby użytkownicy mogli przejrzeć i zweryfikować jego działanie. Ukłony dla autora. Korzystanie jest bezpłatne, jednak ponowna publikacja kodu podlega naszym Zasadom serwisu.
Wyłączenie odpowiedzialności
Informacje i publikacje nie stanowią i nie powinny być traktowane jako porady finansowe, inwestycyjne, tradingowe ani jakiekolwiek inne rekomendacje dostarczane lub zatwierdzone przez TradingView. Więcej informacji znajduje się w Warunkach użytkowania.