OPEN-SOURCE SCRIPT
MASU+ Fib [BTT] (Update)
══════════════════════════════════════════
TRADINGVIEW DESCRIPTION
══════════════════════════════════════════
TITLE:
MASU+ Fib v2.0 [BTT]
SHORT DESCRIPTION:
Non-repainting Fibonacci retracement strategy with 5-layer confluence, MA ribbon, order flow, volatility regime, and MTF alignment. v2.0 fixes repainting.
══════════════════════════════════════════
FULL DESCRIPTION:
══════════════════════════════════════════
█ UPDATE v2.0 — REPAINTING FIX
This is a critical update. The previous version had a repainting issue that produced unrealistic backtest results, including trades opening and closing within seconds with impossibly tight SL/TP levels.
Root cause: calc_on_every_tick was enabled, allowing the strategy to execute on simulated intra-bar ticks during backtesting.
Fixed in v2.0:
— calc_on_every_tick = false
— All entries gated by barstate.isconfirmed (closed bars only)
— Trailing stop properly converted to ticks (/ syminfo.mintick)
— Dashboard uses barstate.islastconfirmedhistory
If you are using v1, please update immediately. Backtest results will be lower but now reflect real-world performance.
█ WHAT IS THIS?
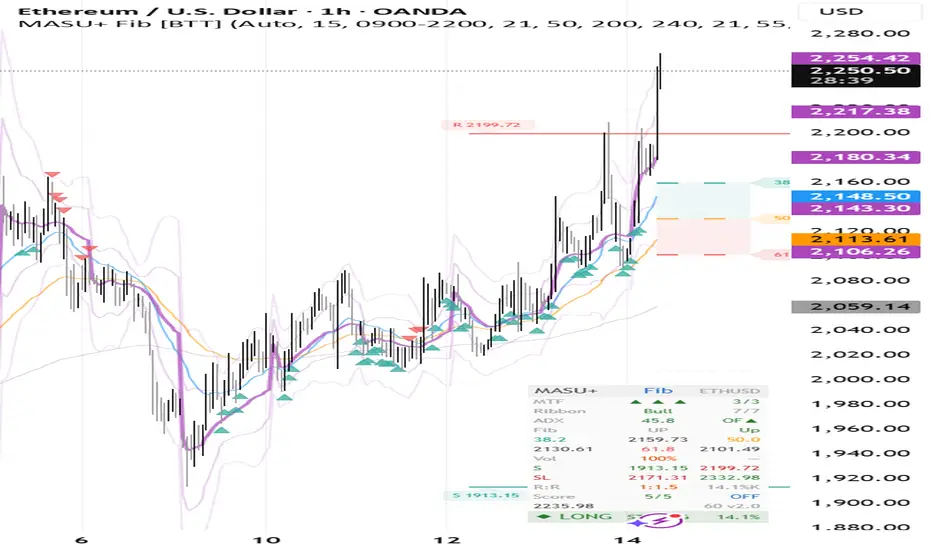
A multi-strategy system that combines trend following, breakout detection, and mean reversion with Fibonacci retracement analysis. Instead of Smart Money Concepts, this version uses dynamic Fibonacci swing detection to identify high-probability entry zones at the 38.2%, 50%, and 61.8% retracement levels.
█ FIBONACCI ENGINE
The strategy automatically detects swing highs and lows using a configurable lookback window, then calculates live Fibonacci retracement levels. Entry signals require price to touch a Fib level AND show a confirming candle pattern:
For longs (upswing retracement):
— Price pulls back to 38.2%, 50%, or 61.8% level
— Candle shows a bullish bounce: lower wick ≥ 25% of candle range, or bullish close above the Fib level
For shorts (downswing retracement):
— Price rallies to 38.2%, 50%, or 61.8% level
— Candle shows bearish rejection: upper wick ≥ 25% of candle range, or bearish close below the Fib level
Visual: Fib levels drawn as colored dashed lines with zone shading between 38.2–50% and 50–61.8%. Extension target at 61.8% above swing high.
█ THREE ENTRY STRATEGIES
The system runs three independent entry engines simultaneously:
Trend Following — EMA 21/50 crossover confirmed by EMA 200 direction and volume spike. Fires in trending markets (ADX > threshold).
Breakout — Price breaks above/below the Donchian channel (highest high / lowest low) with volume confirmation and EMA 200 alignment.
Mean Reversion — Price at Bollinger Band extreme with RSI reversal signal. Fires only in ranging markets (ADX ≤ threshold).
Each entry must pass all 5 confluence filters before execution.
█ 5-LAYER CONFLUENCE FILTERS
Every trade requires alignment across independent analysis layers:
1. MTF Filter — Higher timeframe (default 4H) EMA trend confirmation
2. MA Ribbon — 8-layer Fibonacci ribbon (8/13/21/34/55/89/144/233) with alignment threshold
3. Order Flow — VWAP position + CVD divergence + buy/sell volume delta
4. Fibonacci — Retracement support/resistance + bounce/rejection candle patterns
5. ADX — Minimum trend strength threshold
Confluence score: 0–5. Trades fire only when all enabled filters agree.
█ ORDER FLOW ANALYSIS
Built-in institutional flow detection:
— Session VWAP with ±1σ, ±2σ, ±3σ bands
— Cumulative Volume Delta (CVD) divergence detection
— Buy/sell volume ratio with configurable threshold
— Optional Volume Profile with Point of Control (POC)
█ VOLATILITY REGIME
Automatic market regime classification using dual metrics:
— Bollinger Band width expansion/contraction vs moving average
— ATR percentile ranking over 100 bars
The system identifies trending (expansion + high ATR) vs ranging (contraction + low ATR) environments and routes signals to the appropriate strategy engine.
█ RISK MANAGEMENT
— ATR-based stop loss (default 2.0× ATR)
— ATR-based take profit (default 3.0× ATR)
— Optional trailing stop (default 1.5× ATR) — properly tick-normalized in v2.0
— Kelly Criterion position sizing displayed on dashboard
— Session time filter with configurable trading hours
█ DASHBOARD
Light-themed compact panel (bottom-right) showing:
— MTF trend alignment (15m / 1h / 4h) with score
— MA Ribbon status and alignment count
— ADX value + Order Flow direction
— Fibonacci status (Support / Resist / Up / Down) with live levels
— Volatility percentile + volume pressure
— Support / Resistance levels
— SL / TP values
— Risk/Reward ratio + Kelly %
— Confluence score
— Current session + active signal
█ VISUALIZATION
— Fibonacci zone lines with shaded retracement bands
— Labeled price levels at 38.2%, 50%, 61.8%, and extension
— Diamond entry markers (green buy, red sell)
— Fib bounce/rejection triangles
— Signal background pulse
— Gradient trend candles (RSI-based color intensity)
— EMA lines (21, 50, 200)
— VWAP bands (toggleable)
— Dynamic Support/Resistance lines
— Active TP/SL lines when in position
█ USAGE
— Works on any instrument and timeframe
— Optimized for 15m–4H
— All filters independently toggleable
— Fibonacci parameters fully configurable (swing lookback, zone width, which levels to use)
— Does NOT repaint — backtest = live performance
█ CHANGELOG
v2.0 (current):
— Fixed repainting: calc_on_every_tick=false + barstate.isconfirmed
— Fixed trailing stop tick conversion
— Dashboard anti-repaint (islastconfirmedhistory)
— Version indicator in dashboard
v1.0:
— Initial release with Fibonacci engine replacing SMC
TRADINGVIEW DESCRIPTION
══════════════════════════════════════════
TITLE:
MASU+ Fib v2.0 [BTT]
SHORT DESCRIPTION:
Non-repainting Fibonacci retracement strategy with 5-layer confluence, MA ribbon, order flow, volatility regime, and MTF alignment. v2.0 fixes repainting.
══════════════════════════════════════════
FULL DESCRIPTION:
══════════════════════════════════════════
█ UPDATE v2.0 — REPAINTING FIX
This is a critical update. The previous version had a repainting issue that produced unrealistic backtest results, including trades opening and closing within seconds with impossibly tight SL/TP levels.
Root cause: calc_on_every_tick was enabled, allowing the strategy to execute on simulated intra-bar ticks during backtesting.
Fixed in v2.0:
— calc_on_every_tick = false
— All entries gated by barstate.isconfirmed (closed bars only)
— Trailing stop properly converted to ticks (/ syminfo.mintick)
— Dashboard uses barstate.islastconfirmedhistory
If you are using v1, please update immediately. Backtest results will be lower but now reflect real-world performance.
█ WHAT IS THIS?
A multi-strategy system that combines trend following, breakout detection, and mean reversion with Fibonacci retracement analysis. Instead of Smart Money Concepts, this version uses dynamic Fibonacci swing detection to identify high-probability entry zones at the 38.2%, 50%, and 61.8% retracement levels.
█ FIBONACCI ENGINE
The strategy automatically detects swing highs and lows using a configurable lookback window, then calculates live Fibonacci retracement levels. Entry signals require price to touch a Fib level AND show a confirming candle pattern:
For longs (upswing retracement):
— Price pulls back to 38.2%, 50%, or 61.8% level
— Candle shows a bullish bounce: lower wick ≥ 25% of candle range, or bullish close above the Fib level
For shorts (downswing retracement):
— Price rallies to 38.2%, 50%, or 61.8% level
— Candle shows bearish rejection: upper wick ≥ 25% of candle range, or bearish close below the Fib level
Visual: Fib levels drawn as colored dashed lines with zone shading between 38.2–50% and 50–61.8%. Extension target at 61.8% above swing high.
█ THREE ENTRY STRATEGIES
The system runs three independent entry engines simultaneously:
Trend Following — EMA 21/50 crossover confirmed by EMA 200 direction and volume spike. Fires in trending markets (ADX > threshold).
Breakout — Price breaks above/below the Donchian channel (highest high / lowest low) with volume confirmation and EMA 200 alignment.
Mean Reversion — Price at Bollinger Band extreme with RSI reversal signal. Fires only in ranging markets (ADX ≤ threshold).
Each entry must pass all 5 confluence filters before execution.
█ 5-LAYER CONFLUENCE FILTERS
Every trade requires alignment across independent analysis layers:
1. MTF Filter — Higher timeframe (default 4H) EMA trend confirmation
2. MA Ribbon — 8-layer Fibonacci ribbon (8/13/21/34/55/89/144/233) with alignment threshold
3. Order Flow — VWAP position + CVD divergence + buy/sell volume delta
4. Fibonacci — Retracement support/resistance + bounce/rejection candle patterns
5. ADX — Minimum trend strength threshold
Confluence score: 0–5. Trades fire only when all enabled filters agree.
█ ORDER FLOW ANALYSIS
Built-in institutional flow detection:
— Session VWAP with ±1σ, ±2σ, ±3σ bands
— Cumulative Volume Delta (CVD) divergence detection
— Buy/sell volume ratio with configurable threshold
— Optional Volume Profile with Point of Control (POC)
█ VOLATILITY REGIME
Automatic market regime classification using dual metrics:
— Bollinger Band width expansion/contraction vs moving average
— ATR percentile ranking over 100 bars
The system identifies trending (expansion + high ATR) vs ranging (contraction + low ATR) environments and routes signals to the appropriate strategy engine.
█ RISK MANAGEMENT
— ATR-based stop loss (default 2.0× ATR)
— ATR-based take profit (default 3.0× ATR)
— Optional trailing stop (default 1.5× ATR) — properly tick-normalized in v2.0
— Kelly Criterion position sizing displayed on dashboard
— Session time filter with configurable trading hours
█ DASHBOARD
Light-themed compact panel (bottom-right) showing:
— MTF trend alignment (15m / 1h / 4h) with score
— MA Ribbon status and alignment count
— ADX value + Order Flow direction
— Fibonacci status (Support / Resist / Up / Down) with live levels
— Volatility percentile + volume pressure
— Support / Resistance levels
— SL / TP values
— Risk/Reward ratio + Kelly %
— Confluence score
— Current session + active signal
█ VISUALIZATION
— Fibonacci zone lines with shaded retracement bands
— Labeled price levels at 38.2%, 50%, 61.8%, and extension
— Diamond entry markers (green buy, red sell)
— Fib bounce/rejection triangles
— Signal background pulse
— Gradient trend candles (RSI-based color intensity)
— EMA lines (21, 50, 200)
— VWAP bands (toggleable)
— Dynamic Support/Resistance lines
— Active TP/SL lines when in position
█ USAGE
— Works on any instrument and timeframe
— Optimized for 15m–4H
— All filters independently toggleable
— Fibonacci parameters fully configurable (swing lookback, zone width, which levels to use)
— Does NOT repaint — backtest = live performance
█ CHANGELOG
v2.0 (current):
— Fixed repainting: calc_on_every_tick=false + barstate.isconfirmed
— Fixed trailing stop tick conversion
— Dashboard anti-repaint (islastconfirmedhistory)
— Version indicator in dashboard
v1.0:
— Initial release with Fibonacci engine replacing SMC
Skrypt open-source
W zgodzie z duchem TradingView twórca tego skryptu udostępnił go jako open-source, aby użytkownicy mogli przejrzeć i zweryfikować jego działanie. Ukłony dla autora. Korzystanie jest bezpłatne, jednak ponowna publikacja kodu podlega naszym Zasadom serwisu.

Wyłączenie odpowiedzialności
Informacje i publikacje nie stanowią i nie powinny być traktowane jako porady finansowe, inwestycyjne, tradingowe ani jakiekolwiek inne rekomendacje dostarczane lub zatwierdzone przez TradingView. Więcej informacji znajduje się w Warunkach użytkowania.
Skrypt open-source
W zgodzie z duchem TradingView twórca tego skryptu udostępnił go jako open-source, aby użytkownicy mogli przejrzeć i zweryfikować jego działanie. Ukłony dla autora. Korzystanie jest bezpłatne, jednak ponowna publikacja kodu podlega naszym Zasadom serwisu.
Wyłączenie odpowiedzialności
Informacje i publikacje nie stanowią i nie powinny być traktowane jako porady finansowe, inwestycyjne, tradingowe ani jakiekolwiek inne rekomendacje dostarczane lub zatwierdzone przez TradingView. Więcej informacji znajduje się w Warunkach użytkowania.