Pre-1914 Hard Asset Basket Ratio [Automated Bands]
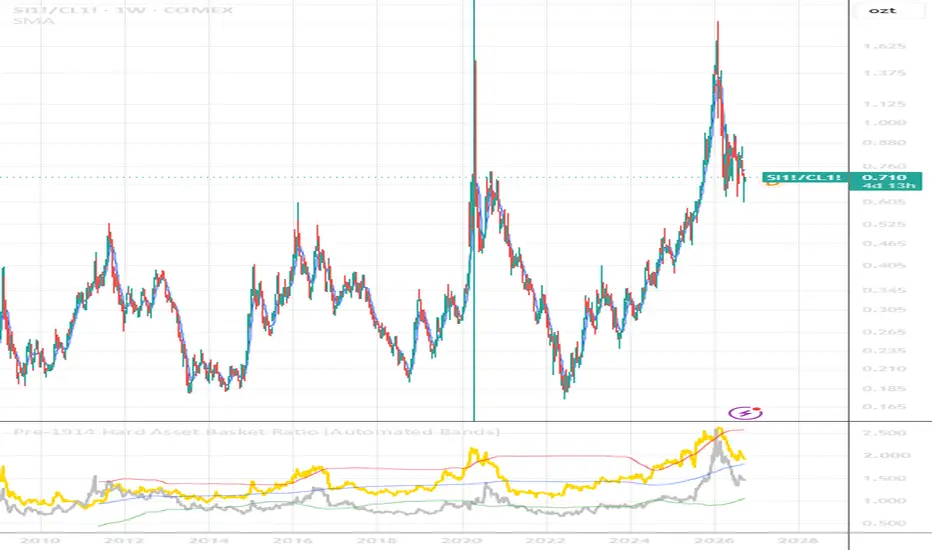
🏛️ Pre-1914 Hard Asset Basket Ratio (with Automated Volatility Bands)
🗺️ Overview
This indicator provides a long-term, un-manipulated macroeconomic value gauge for precious metals. By dividing the price of Gold and Silver by a baseline index of essential raw commodities—Global Brent Crude Oil (NYMEX:BZ1!), Wheat (CBOT:ZW1!), and Industrial Copper (COMEX:HG1!)—this script strips out modern fiat currency debasement and government CPI calculation adjustments (such as hedonic discounting and product substitution).
It answers a core pre-1914 Classical Gold Standard question: How much real, physical wealth does an ounce of precious metal actually command against the core building blocks of civilization?
---
🧮 How It Works & Mathematical Structure
1. Raw Resource Normalization: The indicator constructs a dynamically equal-weighted commodity basket index using continuous futures contracts for deep historical integrity:
Basket Index = (Oil * 1.5) + (Wheat * 15) + (Copper * 300)
(Multipliers are utilized strictly to normalize the price scales across different asset metrics).
2. Inter-Asset Alignment (Scaled Silver): Because silver trades at a significantly lower nominal price than gold, its output is boosted by a factor of 50. This places the Gold Line and Silver Line into the exact same visual field, allowing you to easily contrast their multi-decade cycles.
3. Automated Volatility Channels: The script plots a 200-period rolling Standard Deviation channel (historically known as a Bollinger Band framework) over the gold ratio data to map out structural macro boundaries.
---
📈 How to Read the Indicator Windows
* 🔴 The Red Line (Upper Target Band): The structural volatility ceiling. When the Gold Line hits or pierces this threshold, precious metals are exceptionally overextended relative to the real economy. This typically happens during systemic liquidity crises or market shocks (e.g., 2016, 2020). Macro Signal: A historically poor time to buy bullion; look to defend profits or rotate capital into undervalued tangible assets.
* 🔵 The Blue Line (Macro Mean Centerline): The long-term running equilibrium. The asset ratios will consistently treat this baseline as a magnetic anchor, eventually pulling back to it after periods of mania or panic.
* 🟢 The Green Line (Lower Target Band): The structural value floor. When the Gold Line sinks down to touch this zone, raw commodities are surging while precious metals are lagging behind. Macro Signal: A classic pre-1914 asset accumulation window.
---
⚖️ Spotting the Silver Disconnect (The Strategic Play)
By combining both metrics into one oscillator panel, you can instantly observe the valuation gap between the two primary precious metals. If the Gold Line is testing the upper Red Band due to central bank safe-haven buying, but the Silver Line is lagging down near the Blue Centerline or Green Floor, the chart exposes a severe market anomaly. Historically, this divergence flags that silver is heavily discounted and offers superior long-term asymmetric upside.
⚙️ User Settings
* Lookback Length (Default: 200): Adjusts the timeline used to calculate the historical mean.
* StdDev Multiplier (Default: 2.0): Tighten to 1.5 for more frequent tactical swing signals, or widen to 2.5 to isolate only absolute generational turning points.
🗺️ Overview
This indicator provides a long-term, un-manipulated macroeconomic value gauge for precious metals. By dividing the price of Gold and Silver by a baseline index of essential raw commodities—Global Brent Crude Oil (NYMEX:BZ1!), Wheat (CBOT:ZW1!), and Industrial Copper (COMEX:HG1!)—this script strips out modern fiat currency debasement and government CPI calculation adjustments (such as hedonic discounting and product substitution).
It answers a core pre-1914 Classical Gold Standard question: How much real, physical wealth does an ounce of precious metal actually command against the core building blocks of civilization?
---
🧮 How It Works & Mathematical Structure
1. Raw Resource Normalization: The indicator constructs a dynamically equal-weighted commodity basket index using continuous futures contracts for deep historical integrity:
Basket Index = (Oil * 1.5) + (Wheat * 15) + (Copper * 300)
(Multipliers are utilized strictly to normalize the price scales across different asset metrics).
2. Inter-Asset Alignment (Scaled Silver): Because silver trades at a significantly lower nominal price than gold, its output is boosted by a factor of 50. This places the Gold Line and Silver Line into the exact same visual field, allowing you to easily contrast their multi-decade cycles.
3. Automated Volatility Channels: The script plots a 200-period rolling Standard Deviation channel (historically known as a Bollinger Band framework) over the gold ratio data to map out structural macro boundaries.
---
📈 How to Read the Indicator Windows
* 🔴 The Red Line (Upper Target Band): The structural volatility ceiling. When the Gold Line hits or pierces this threshold, precious metals are exceptionally overextended relative to the real economy. This typically happens during systemic liquidity crises or market shocks (e.g., 2016, 2020). Macro Signal: A historically poor time to buy bullion; look to defend profits or rotate capital into undervalued tangible assets.
* 🔵 The Blue Line (Macro Mean Centerline): The long-term running equilibrium. The asset ratios will consistently treat this baseline as a magnetic anchor, eventually pulling back to it after periods of mania or panic.
* 🟢 The Green Line (Lower Target Band): The structural value floor. When the Gold Line sinks down to touch this zone, raw commodities are surging while precious metals are lagging behind. Macro Signal: A classic pre-1914 asset accumulation window.
---
⚖️ Spotting the Silver Disconnect (The Strategic Play)
By combining both metrics into one oscillator panel, you can instantly observe the valuation gap between the two primary precious metals. If the Gold Line is testing the upper Red Band due to central bank safe-haven buying, but the Silver Line is lagging down near the Blue Centerline or Green Floor, the chart exposes a severe market anomaly. Historically, this divergence flags that silver is heavily discounted and offers superior long-term asymmetric upside.
⚙️ User Settings
* Lookback Length (Default: 200): Adjusts the timeline used to calculate the historical mean.
* StdDev Multiplier (Default: 2.0): Tighten to 1.5 for more frequent tactical swing signals, or widen to 2.5 to isolate only absolute generational turning points.

Wyłączenie odpowiedzialności
Informacje i publikacje nie stanowią i nie powinny być traktowane jako porady finansowe, inwestycyjne, tradingowe ani jakiekolwiek inne rekomendacje dostarczane lub zatwierdzone przez TradingView. Więcej informacji znajduje się w Warunkach użytkowania.
Wyłączenie odpowiedzialności
Informacje i publikacje nie stanowią i nie powinny być traktowane jako porady finansowe, inwestycyjne, tradingowe ani jakiekolwiek inne rekomendacje dostarczane lub zatwierdzone przez TradingView. Więcej informacji znajduje się w Warunkach użytkowania.