OPEN-SOURCE SCRIPT
Zaktualizowano Accumulation Distribution Divergence
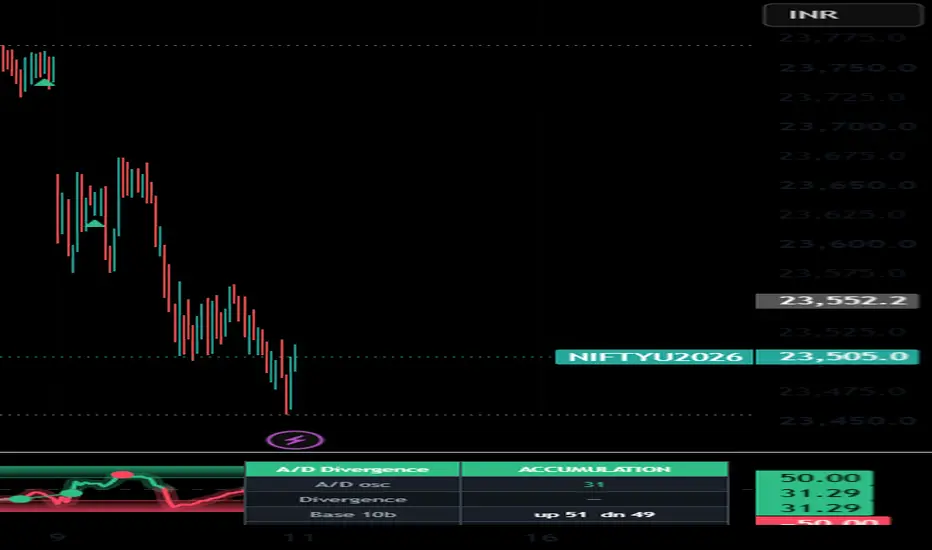
Overview
Accumulation Distribution Divergence turns Chaikin's Accumulation/Distribution line into a bounded pane oscillator and runs a price/oscillator divergence engine on it, with a built-in forward-calibration harness that measures whether those divergences have actually preceded a move on your instrument. It is an analytical study of accumulation versus distribution — not a strategy, not a signal, not a recommendation.
What it measures — and why it is not another CVD/MFI tool
The A/D line measures a different physical quantity from the volume oscillators most traders already run. Cumulative Volume Delta signs an entire bar's volume by tick direction; the Money Flow Index weights volume by typical price. The A/D line instead weights each bar's volume by its Close-Location-Value — how close the bar finishes to its high versus its low — so a bar that opens weak but closes on its high still accumulates. Because the input quantity is different, an A/D-line divergence is an independent read of who is in control, not a restatement of a signed-tick or typical-price oscillator. That independence is the entire point of running it alongside your existing volume tools.
How the three components work together (why they are combined)
This is a deliberate three-part construction, not a random stack. Each part answers a question the previous one leaves open:
The oscillator answers "is volume accumulating or distributing right now?" — the raw A/D line drifts endlessly and can't be read on a fixed scale, so it is detrended (subtract its EMA), z-scored over a window to put it on a portable σ axis, and tanh-squashed to a soft ±100 pane where 0 is balance and the ±50 bands mark an accumulation/distribution edge.
The divergence engine answers "is that flow diverging from price?" — it compares confirmed price pivots to the oscillator at those pivots. Regular divergence (price makes a new extreme, flow does not) flags thinning conviction; hidden divergence flags trend continuation. Divergence alone, though, is famously prone to firing early and often.
The calibration harness answers the question every divergence tool leaves unanswered: "has this class of divergence actually paid on this symbol?" Every regular divergence is queued and resolved a fixed horizon later against the unconditional same-horizon base rate, and the dashboard reports Hit % / Edge / sample size with a Wilson-score-gated star. A divergence that never beats the base rate is adding no information — and now you can see that instead of assuming it.
Together: a distinct volume lens, a divergence read on it, and an honesty layer that tells you whether the read is worth anything on the instrument in front of you.
How to use it
Read the oscillator's side and slope — above 0 is net accumulation, below 0 is net distribution.
Treat a divergence mark as context (conviction thinning or trend confirming), never as a standalone entry. It marks a condition, not a trade.
Read the dashboard before you weight a divergence: if the Bull/Bear Edge is not clearly positive with an adequate sample and a star, that class is not carrying an edge on this instrument right now.
Combine with your own level/trend framework and risk rules. This tool describes behaviour; it does not decide anything for you.
Settings
Five grouped sections: Data source (High/Low series for the pivots — configurable so the engine runs on any market), A/D engine (detrend EMA and normalization window), Divergence (pivot strength, max bars between pivots, hidden on/off, connecting lines), Calibration (forward horizon, minimum sample for stars), and Dashboard & theme (position, auto/dark/light palette that reads the chart background so the table stays legible, and the bull/bear colours).
Universality & data note
High/Low are inputs, so the divergence engine works on any symbol or timeframe. The A/D line, however, needs real volume — on a no-volume symbol (like a cash index) the dashboard reads "no volume" and no signals fire. Use the futures contract. Defaults target liquid index-futures intraday; change the sources and lengths for any other asset.
Non-repainting
Pivots confirm a fixed number of bars after the fact and do not move once printed. The calibration harness logs and resolves only on confirmed bars, so its statistics never repaint. The live oscillator value updates each bar, like any oscillator.
Originality
The Accumulation/Distribution line and Close-Location-Value are Marc Chaikin's public concepts; the Wilson score interval is Edwin B. Wilson's; price/oscillator divergence is a standard public technique. What is original here is the specific construction: the detrend → z-score → tanh-squash oscillator that makes the A/D line readable on a fixed bounded scale, the combined regular+hidden divergence engine keyed to that oscillator, and — most importantly — the forward-calibration harness that scores each divergence class against its unconditional base rate with a Wilson-gated confidence read. This is a clean-room implementation; no third-party script code is reused.
Concept credits
Accumulation/Distribution line & Close-Location-Value — Marc Chaikin
Wilson score confidence interval — Edwin B. Wilson
Price/oscillator divergence — standard public technical-analysis technique
Disclaimer
Educational / informational only. Not financial advice, not a signal, not a recommendation. The oscillator describes past volume-and-location behaviour; the edge figures are in-sample, forward-measured at a fixed horizon over overlapping windows, with no costs, slippage or stops — read them as context, not a verified backtest. Past behaviour does not assure future behaviour. Markets carry risk. Do your own research and paper-trade before risking capital; you alone are responsible for your decisions.
Accumulation Distribution Divergence turns Chaikin's Accumulation/Distribution line into a bounded pane oscillator and runs a price/oscillator divergence engine on it, with a built-in forward-calibration harness that measures whether those divergences have actually preceded a move on your instrument. It is an analytical study of accumulation versus distribution — not a strategy, not a signal, not a recommendation.
What it measures — and why it is not another CVD/MFI tool
The A/D line measures a different physical quantity from the volume oscillators most traders already run. Cumulative Volume Delta signs an entire bar's volume by tick direction; the Money Flow Index weights volume by typical price. The A/D line instead weights each bar's volume by its Close-Location-Value — how close the bar finishes to its high versus its low — so a bar that opens weak but closes on its high still accumulates. Because the input quantity is different, an A/D-line divergence is an independent read of who is in control, not a restatement of a signed-tick or typical-price oscillator. That independence is the entire point of running it alongside your existing volume tools.
How the three components work together (why they are combined)
This is a deliberate three-part construction, not a random stack. Each part answers a question the previous one leaves open:
The oscillator answers "is volume accumulating or distributing right now?" — the raw A/D line drifts endlessly and can't be read on a fixed scale, so it is detrended (subtract its EMA), z-scored over a window to put it on a portable σ axis, and tanh-squashed to a soft ±100 pane where 0 is balance and the ±50 bands mark an accumulation/distribution edge.
The divergence engine answers "is that flow diverging from price?" — it compares confirmed price pivots to the oscillator at those pivots. Regular divergence (price makes a new extreme, flow does not) flags thinning conviction; hidden divergence flags trend continuation. Divergence alone, though, is famously prone to firing early and often.
The calibration harness answers the question every divergence tool leaves unanswered: "has this class of divergence actually paid on this symbol?" Every regular divergence is queued and resolved a fixed horizon later against the unconditional same-horizon base rate, and the dashboard reports Hit % / Edge / sample size with a Wilson-score-gated star. A divergence that never beats the base rate is adding no information — and now you can see that instead of assuming it.
Together: a distinct volume lens, a divergence read on it, and an honesty layer that tells you whether the read is worth anything on the instrument in front of you.
How to use it
Read the oscillator's side and slope — above 0 is net accumulation, below 0 is net distribution.
Treat a divergence mark as context (conviction thinning or trend confirming), never as a standalone entry. It marks a condition, not a trade.
Read the dashboard before you weight a divergence: if the Bull/Bear Edge is not clearly positive with an adequate sample and a star, that class is not carrying an edge on this instrument right now.
Combine with your own level/trend framework and risk rules. This tool describes behaviour; it does not decide anything for you.
Settings
Five grouped sections: Data source (High/Low series for the pivots — configurable so the engine runs on any market), A/D engine (detrend EMA and normalization window), Divergence (pivot strength, max bars between pivots, hidden on/off, connecting lines), Calibration (forward horizon, minimum sample for stars), and Dashboard & theme (position, auto/dark/light palette that reads the chart background so the table stays legible, and the bull/bear colours).
Universality & data note
High/Low are inputs, so the divergence engine works on any symbol or timeframe. The A/D line, however, needs real volume — on a no-volume symbol (like a cash index) the dashboard reads "no volume" and no signals fire. Use the futures contract. Defaults target liquid index-futures intraday; change the sources and lengths for any other asset.
Non-repainting
Pivots confirm a fixed number of bars after the fact and do not move once printed. The calibration harness logs and resolves only on confirmed bars, so its statistics never repaint. The live oscillator value updates each bar, like any oscillator.
Originality
The Accumulation/Distribution line and Close-Location-Value are Marc Chaikin's public concepts; the Wilson score interval is Edwin B. Wilson's; price/oscillator divergence is a standard public technique. What is original here is the specific construction: the detrend → z-score → tanh-squash oscillator that makes the A/D line readable on a fixed bounded scale, the combined regular+hidden divergence engine keyed to that oscillator, and — most importantly — the forward-calibration harness that scores each divergence class against its unconditional base rate with a Wilson-gated confidence read. This is a clean-room implementation; no third-party script code is reused.
Concept credits
Accumulation/Distribution line & Close-Location-Value — Marc Chaikin
Wilson score confidence interval — Edwin B. Wilson
Price/oscillator divergence — standard public technical-analysis technique
Disclaimer
Educational / informational only. Not financial advice, not a signal, not a recommendation. The oscillator describes past volume-and-location behaviour; the edge figures are in-sample, forward-measured at a fixed horizon over overlapping windows, with no costs, slippage or stops — read them as context, not a verified backtest. Past behaviour does not assure future behaviour. Markets carry risk. Do your own research and paper-trade before risking capital; you alone are responsible for your decisions.
Informacje o Wersji
v1.1 — Three additive layers: robust normalization, a 3-window extreme consensus, and a walk-forward out-of-sample reliability read. Chaikin's A/D line, the detrend, the regular + hidden divergence engine and the forward-calibration harness are unchanged — set Normalization = "Classic (mean/stdev)" and Extreme normalization = "Single window" for the original read.1. Robust MAD normalization (default on). The detrended A/D line can be standardized with a median/MAD z-score (median absolute deviation ×1.4826) instead of mean/stdev. A/D throws fat outlier bars around news; MAD ignores them so the ±50 bands and zones keep a stable meaning. Selectable via "Normalization".
2. 3-window extreme consensus (opt-in, default off). The z can be taken as the MEDIAN of the z computed at half, one and double the normalization window, so a reading is flagged extreme only when short, medium and long horizons agree. Default "Single window" leaves v1.0 behaviour exactly.
3. Walk-forward out-of-sample reliability. The forward calibration already scores each divergence class vs the base rate — but that's in-sample. This adds a genuine split: the first N resolved signals TRAIN, every signal after is scored OUT-OF-SAMPLE, shown on a new "OOS win (walk-fwd)" dashboard row and exported as EXP_OOSLongEdge / EXP_OOSShortEdge. The OOS number is the trustworthy one.
What is unchanged. The Close-Location-Value weighting, the cumulative A/D line, the detrend-and-squash construction, the regular + hidden pivot divergence engine and the unconditional-base-rate calibration (Wilson-gated stars) are byte-for-byte v1.0. The new layers only read existing series.
Still context, not a signal — needs real volume (use a futures contract). Non-repaint: late-confirming pivots, calibration logs and resolves on confirmed bars. Concept credits unchanged (Chaikin A/D & CLV; Wilson interval; price/oscillator divergence).
Informacje o Wersji
v1.2 — R1 honest-stats standardization. Robust-z and the Wilson-lower-bound star/edge math now come from the published calibration libraries (ml_robuststats/2, ml_calib/2), byte-identical to the prior local helpers — so the oscillator, the divergence marks and every calibration number are unchanged. One shared calibration engine across the divergence family. Educational; in-sample figures are context, not a verified backtest.Skrypt open-source
W zgodzie z duchem TradingView twórca tego skryptu udostępnił go jako open-source, aby użytkownicy mogli przejrzeć i zweryfikować jego działanie. Ukłony dla autora. Korzystanie jest bezpłatne, jednak ponowna publikacja kodu podlega naszym Zasadom serwisu.

Wyłączenie odpowiedzialności
Informacje i publikacje nie stanowią i nie powinny być traktowane jako porady finansowe, inwestycyjne, tradingowe ani jakiekolwiek inne rekomendacje dostarczane lub zatwierdzone przez TradingView. Więcej informacji znajduje się w Warunkach użytkowania.
Skrypt open-source
W zgodzie z duchem TradingView twórca tego skryptu udostępnił go jako open-source, aby użytkownicy mogli przejrzeć i zweryfikować jego działanie. Ukłony dla autora. Korzystanie jest bezpłatne, jednak ponowna publikacja kodu podlega naszym Zasadom serwisu.
Wyłączenie odpowiedzialności
Informacje i publikacje nie stanowią i nie powinny być traktowane jako porady finansowe, inwestycyjne, tradingowe ani jakiekolwiek inne rekomendacje dostarczane lub zatwierdzone przez TradingView. Więcej informacji znajduje się w Warunkach użytkowania.