OPEN-SOURCE SCRIPT
Zaktualizowano GMS Ultimate Indicator
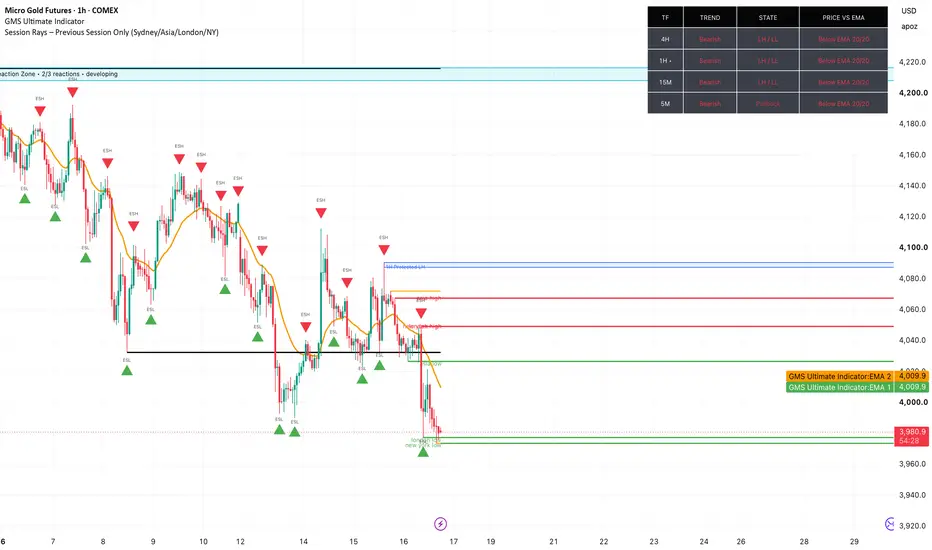
GMS Ultimate Indicator 9.0 is a customizable multi timeframe market structure and price action tool designed to help traders stay aligned with the dominant side of the market.
It analyzes the Daily, 4H, 1H, 15M, 5M, and 1M trends using HH/HL and LH/LL structure, while identifying pullbacks, consolidation, liquidity sweeps, BOS, CHOCH, protected structure, reaction zones, retests, and rejection candles. Its setup engine helps locate higher probability entries within the broader trend, with adjustable alerts, dashboard layouts, and display settings.
For analysis and educational purposes only. Use proper risk management and backtesting.
It analyzes the Daily, 4H, 1H, 15M, 5M, and 1M trends using HH/HL and LH/LL structure, while identifying pullbacks, consolidation, liquidity sweeps, BOS, CHOCH, protected structure, reaction zones, retests, and rejection candles. Its setup engine helps locate higher probability entries within the broader trend, with adjustable alerts, dashboard layouts, and display settings.
For analysis and educational purposes only. Use proper risk management and backtesting.
Informacje o Wersji
GMS Ultimate Indicator is a customizable multi timeframe market structure and price action tool designed to help traders stay aligned with the market’s direction. It tracks 4H, 1H, 15M, and 5M trend conditions, structure state, and price position relative to selected EMAs.The indicator also identifies BOS, CHOCH, swing highs and lows, liquidity pools and sweeps, previous day/week levels, protected 1H structure, 4H reaction zones, retests, rejection candles, potential setups, targets, and alerts.
Built for scalpers, intraday traders, and swing traders who use market structure and price action. For analysis and educational purposes only.
Informacje o Wersji
GMS Ultimate Indicator is a customizable multi timeframe market structure and price action tool designed to help traders stay aligned with the market’s direction. It tracks 4H, 1H, 15M, and 5M trend conditions, structure state, and price position relative to selected EMAs.The indicator also identifies BOS, CHOCH, swing highs and lows, liquidity pools and sweeps, previous day/week levels, protected 1H structure, 4H reaction zones, retests, rejection candles, potential setups, targets, and alerts.
Built for scalpers, intraday traders, and swing traders who use market structure and price action. For analysis and educational purposes only.
Informacje o Wersji
GMS Ultimate Indicator is a customizable multi timeframe market structure and price action tool designed to help traders stay aligned with the market’s direction. It tracks 4H, 1H, 15M, and 5M trend conditions, structure state, and price position relative to selected EMAs.The indicator also identifies BOS, CHOCH, swing highs and lows, liquidity pools and sweeps, previous day/week levels, protected 1H structure, 4H reaction zones, retests, rejection candles, potential setups, targets, and alerts.
Built for scalpers, intraday traders, and swing traders who use market structure and price action. For analysis and educational purposes only.
Informacje o Wersji
GMS Ultimate Indicator is a customizable multi timeframe market structure and price action tool designed to help traders stay aligned with the market’s direction. It tracks 4H, 1H, 15M, and 5M trend conditions, structure state, and price position relative to selected EMAs.The indicator also identifies BOS, CHOCH, swing highs and lows, liquidity pools and sweeps, previous day/week levels, protected 1H structure, 4H reaction zones, retests, rejection candles, potential setups, targets, and alerts.
Built for scalpers, intraday traders, and swing traders who use market structure and price action. For analysis and educational purposes only.
Informacje o Wersji
Updated : 12.9GMS Ultimate Indicator is a customizable multi timeframe market structure and price action tool designed to help traders stay aligned with the dominant side of the market.
It analyzes the Daily, 4H, 1H, 15M, 5M, and 1M trends using HH/HL and LH/LL structure, while identifying pullbacks, consolidation, liquidity sweeps, BOS, CHOCH, protected structure, reaction zones, retests, and rejection candles. Its setup engine helps locate higher probability entries within the broader trend, with adjustable alerts, dashboard layouts, and display settings.
For analysis and educational purposes only. Use proper risk management and backtesting.
Informacje o Wersji
Updated v 13.0 GMS Ultimate Indicator is a customizable multi timeframe market structure and price action tool designed to help traders stay aligned with the dominant side of the market.
It analyzes the Daily, 4H, 1H, 15M, 5M, and 1M trends using HH/HL and LH/LL structure, while identifying pullbacks, consolidation, liquidity sweeps, BOS, CHOCH, protected structure, reaction zones, retests, and rejection candles. Its setup engine helps locate higher probability entries within the broader trend, with adjustable alerts, dashboard layouts, and display settings.
For analysis and educational purposes only. Use proper risk management and backtesting.
Skrypt open-source
W zgodzie z duchem TradingView twórca tego skryptu udostępnił go jako open-source, aby użytkownicy mogli przejrzeć i zweryfikować jego działanie. Ukłony dla autora. Korzystanie jest bezpłatne, jednak ponowna publikacja kodu podlega naszym Zasadom serwisu.

Wyłączenie odpowiedzialności
Informacje i publikacje nie stanowią i nie powinny być traktowane jako porady finansowe, inwestycyjne, tradingowe ani jakiekolwiek inne rekomendacje dostarczane lub zatwierdzone przez TradingView. Więcej informacji znajduje się w Warunkach użytkowania.
Skrypt open-source
W zgodzie z duchem TradingView twórca tego skryptu udostępnił go jako open-source, aby użytkownicy mogli przejrzeć i zweryfikować jego działanie. Ukłony dla autora. Korzystanie jest bezpłatne, jednak ponowna publikacja kodu podlega naszym Zasadom serwisu.
Wyłączenie odpowiedzialności
Informacje i publikacje nie stanowią i nie powinny być traktowane jako porady finansowe, inwestycyjne, tradingowe ani jakiekolwiek inne rekomendacje dostarczane lub zatwierdzone przez TradingView. Więcej informacji znajduje się w Warunkach użytkowania.