Daily ATR X500
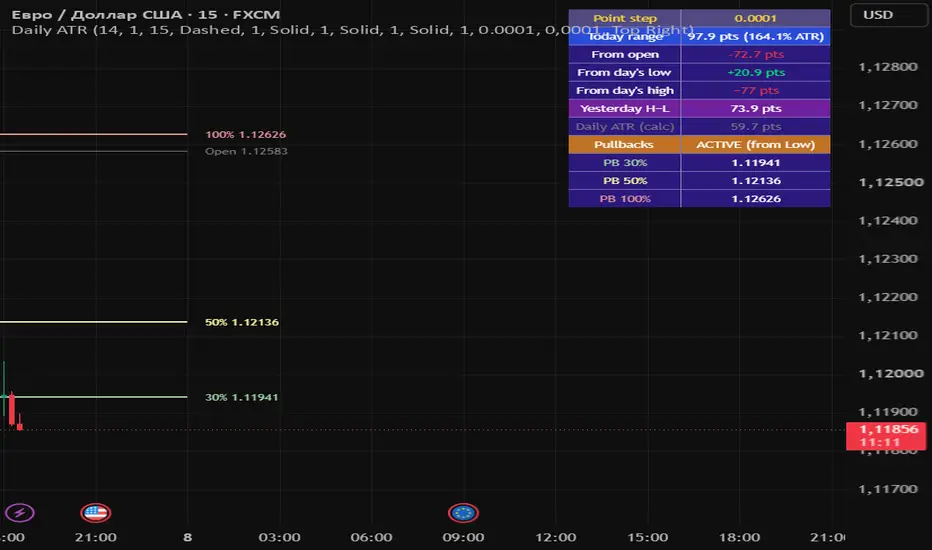
Daily ATR shows expected daily movement from the symbol’s session day open, using Average True Range on the daily timeframe. When the day’s actual High–Low has already reached that ATR, the forecast is replaced by pullback levels at 30%, 50% and 100% of the real day range.
HOW IT WORKS
• ATR is calculated on the Daily chart (default length 14).
• Today’s forecast uses yesterday’s closed ATR (does not use an unfinished daily bar).
PHASE 1 — Forecast (today’s High−Low still below ATR)
• ATR+ = Open + ATR × K
• ATR− = Open − ATR × K
• Default K = 1 → full ATR possible up and full ATR possible down from the open.
• Optional green/red fills and labels on the active day.
PHASE 2 — Pullbacks (today’s High−Low ≥ ATR)
• Forecast Open±ATR is hidden.
• Three levels of the actual day range (High−Low):
– 30% (light green)
– 50% (light yellow)
– 100% (light red)
• Direction:
– Price closer to the day High → pullback levels down from High
– Price closer to the day Low → pullback levels up from Low
• When the session day closes, pullbacks are removed and the day is drawn as actual Open / High / Low. A new day starts with a fresh forecast.
CLOSED DAYS (history)
• Actual Open, High and Low for the selected number of history days.
• Vertical line at each session day open.
INFO TABLE
• Point step used for “pts”
• Today range (+ % of ATR)
• From open / from day’s low / from day’s high
• Yesterday H−L
• Daily ATR (calc)
• Pullbacks status (ACTIVE from High/Low, or off)
• While forecasting: Possible up / Possible down
• While pullbacks active: PB 30% / PB 50% / PB 100% prices
POINT STEP (important)
There is no universal “point” across all markets.
points = price distance ÷ Point step
Suggested starting values (adjust per instrument):
• EURUSD, GBPUSD and most FX majors → 0.0001
• USDJPY and other JPY pairs → 0.01
• XAUUSD (gold) → 0.1
• Or use mintick / manual
If table numbers look huge, the step is too small.
If they look tiny, the step is too large.
The chosen step is shown in the first table row.
SUGGESTED DEFAULTS
• Length: 14
• Multiplier (K): 1.0
• History days: 15
• Enable pullback levels: On
• Point step: set for your symbol (see above)
• Show table: On
Best on intraday charts (e.g. M15–H1) so you can watch the live day band and the switch to pullbacks.
This is a volatility / range reference tool. It does not generate buy or sell signals. Past ATR does not guarantee future range.
HOW IT WORKS
• ATR is calculated on the Daily chart (default length 14).
• Today’s forecast uses yesterday’s closed ATR (does not use an unfinished daily bar).
PHASE 1 — Forecast (today’s High−Low still below ATR)
• ATR+ = Open + ATR × K
• ATR− = Open − ATR × K
• Default K = 1 → full ATR possible up and full ATR possible down from the open.
• Optional green/red fills and labels on the active day.
PHASE 2 — Pullbacks (today’s High−Low ≥ ATR)
• Forecast Open±ATR is hidden.
• Three levels of the actual day range (High−Low):
– 30% (light green)
– 50% (light yellow)
– 100% (light red)
• Direction:
– Price closer to the day High → pullback levels down from High
– Price closer to the day Low → pullback levels up from Low
• When the session day closes, pullbacks are removed and the day is drawn as actual Open / High / Low. A new day starts with a fresh forecast.
CLOSED DAYS (history)
• Actual Open, High and Low for the selected number of history days.
• Vertical line at each session day open.
INFO TABLE
• Point step used for “pts”
• Today range (+ % of ATR)
• From open / from day’s low / from day’s high
• Yesterday H−L
• Daily ATR (calc)
• Pullbacks status (ACTIVE from High/Low, or off)
• While forecasting: Possible up / Possible down
• While pullbacks active: PB 30% / PB 50% / PB 100% prices
POINT STEP (important)
There is no universal “point” across all markets.
points = price distance ÷ Point step
Suggested starting values (adjust per instrument):
• EURUSD, GBPUSD and most FX majors → 0.0001
• USDJPY and other JPY pairs → 0.01
• XAUUSD (gold) → 0.1
• Or use mintick / manual
If table numbers look huge, the step is too small.
If they look tiny, the step is too large.
The chosen step is shown in the first table row.
SUGGESTED DEFAULTS
• Length: 14
• Multiplier (K): 1.0
• History days: 15
• Enable pullback levels: On
• Point step: set for your symbol (see above)
• Show table: On
Best on intraday charts (e.g. M15–H1) so you can watch the live day band and the switch to pullbacks.
This is a volatility / range reference tool. It does not generate buy or sell signals. Past ATR does not guarantee future range.

Wyłączenie odpowiedzialności
Informacje i publikacje nie stanowią i nie powinny być traktowane jako porady finansowe, inwestycyjne, tradingowe ani jakiekolwiek inne rekomendacje dostarczane lub zatwierdzone przez TradingView. Więcej informacji znajduje się w Warunkach użytkowania.
Wyłączenie odpowiedzialności
Informacje i publikacje nie stanowią i nie powinny być traktowane jako porady finansowe, inwestycyjne, tradingowe ani jakiekolwiek inne rekomendacje dostarczane lub zatwierdzone przez TradingView. Więcej informacji znajduje się w Warunkach użytkowania.