Autocorrelation Periodogram [RC Tools]
RC Tools — Autocorrelation Periodogram
────────────────────────────────────────────────────────────────────
█ OVERVIEW
Most indicators ask you to choose a lookback length and hope it suits the market. This one asks the market instead. John Ehlers' Autocorrelation Periodogram estimates the DOMINANT CYCLE LENGTH, how many bars the market's current rhythm takes from one swing to the next, so that the length is measured rather than guessed. It also says how strongly that cycle stands out, because a cycle length only means something when a cycle is actually there.
█ WHAT IT DOES
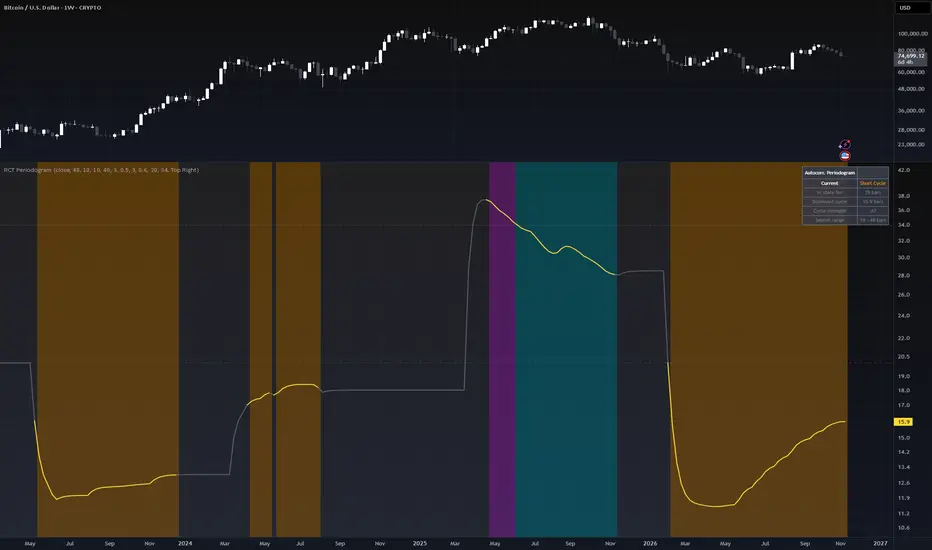
Estimates the dominant cycle length, in bars, on every confirmed bar and plots it in its own pane. The line turns grey when no clear cycle is present. Each bar is classified as Short Cycle, Medium Cycle, Long Cycle or No Clear Cycle, with the background coloured accordingly. A table shows the current state, how long it has lasted, the dominant cycle length, the cycle strength (0 to 1), and the range of cycle lengths being searched.
█ THE THEORY BEHIND IT
If a market is swinging in a regular rhythm, its filtered price will tend to resemble itself when shifted by one full cycle. Autocorrelation measures exactly that: how well a series correlates with a delayed copy of itself. Measure it at every delay from 0 up to the longest cycle you care about, and you have a fingerprint of the market's rhythm. A Fourier transform of that fingerprint converts it from "similarity at each delay" into "how much power sits at each cycle length", a spectrum. The cycle lengths with the most power are the ones the market is actually doing. This is a public, long-established signal-processing technique that Ehlers adapted for price data.
█ HOW IT IS CALCULATED
1. Pre-filter price with a roofing filter: a two-pole high-pass filter (default cutoff 48 bars) removes trend drift, then a two-pole Super Smoother (default cutoff 10 bars) removes noise.
2. Compute the autocorrelation of the filtered series at each lag from 0 up to the longest cycle searched (default 48), averaging over a few bars (default 3) for stability.
3. Take a discrete Fourier transform of those autocorrelations to get power at each candidate cycle length (default 10 to 48 bars), and smooth it over time.
4. Normalise power against a slowly decaying running maximum.
5. Dominant cycle = the power-weighted average of every cycle length whose normalised power is at or above the dominance threshold (default 0.5). Optionally EMA-smooth the result.
6. Cycle strength = the highest current power divided by the running maximum, from 0 to 1.
7. Classify: below the strength threshold = No Clear Cycle; otherwise Short, Medium or Long by the dominant cycle length against two configurable boundaries (defaults 20 and 34 bars).
Everything updates ONLY on confirmed bar close. The plot, background and table update together on closed bars, so nothing flips mid-bar.
█ SETTINGS & CONFIGURATION
• Source (default close)
• High-Pass / Low-Pass Cutoffs for the pre-filter (defaults 48 / 10)
• Shortest / Longest Cycle Searched (defaults 10 / 48 bars). A larger longest-cycle value costs more computation
• Correlation Averaging (default 3 bars) and Dominance Threshold (default 0.5)
• Output Smoothing (default 3 bars)
• Clear-Cycle Strength (default 0.6) and the Short/Medium and Medium/Long boundaries
• Table position, band colours, pane background and optional main-chart background tint are all configurable
█ HOW TO USE IT
Use it to choose lookback lengths for your other tools from evidence rather than habit. If the dominant cycle is running near 24 bars, indicators tuned to that rhythm tend to behave better than ones tuned far from it. A rising dominant-cycle line means the market's swings are lengthening; a falling one means they are speeding up. Give the strength reading as much weight as the length itself: when the line is grey, the market is not showing a clear rhythm and the length should be disregarded, not trusted.
Works on any asset and timeframe; lengths are in bars, so the same reading means different clock time on different timeframes.
█ LIMITATIONS
• A dominant-cycle estimate only means something when a cycle exists. In trending or random-looking stretches the spectrum has no clear peak and the reported length wanders. That is exactly what the cycle-strength reading and the No Clear Cycle band are for.
• It measures the market's recent rhythm. It does NOT forecast when the next turn will occur.
• Resolution is coarser at longer periods: a 40-bar cycle is harder to pin to the exact bar than a 15-bar cycle.
• Only cycles inside the search range can be reported. Cycles shorter than the minimum or longer than the maximum are invisible to it.
• The roofing pre-filter adds a small, unavoidable lag.
• It needs a long warm-up (about two high-pass cutoffs plus the longest cycle searched) before the reading is trustworthy, so the plot starts well after the first bar on a new chart.
• The strength and boundary thresholds are sensible starting points, not universal constants; adjust them to the market you trade.
• Four states are a deliberate simplification of a continuous reality.
• Everything updates on confirmed bar close only. This script does NOT repaint.
█ DISCLAIMER
For educational and informational purposes only. Nothing here is financial advice. Past behaviour of any cycle state does not indicate future results. Trade at your own risk.
────────────────────────────────────────────────────────────────────
────────────────────────────────────────────────────────────────────
█ OVERVIEW
Most indicators ask you to choose a lookback length and hope it suits the market. This one asks the market instead. John Ehlers' Autocorrelation Periodogram estimates the DOMINANT CYCLE LENGTH, how many bars the market's current rhythm takes from one swing to the next, so that the length is measured rather than guessed. It also says how strongly that cycle stands out, because a cycle length only means something when a cycle is actually there.
█ WHAT IT DOES
Estimates the dominant cycle length, in bars, on every confirmed bar and plots it in its own pane. The line turns grey when no clear cycle is present. Each bar is classified as Short Cycle, Medium Cycle, Long Cycle or No Clear Cycle, with the background coloured accordingly. A table shows the current state, how long it has lasted, the dominant cycle length, the cycle strength (0 to 1), and the range of cycle lengths being searched.
█ THE THEORY BEHIND IT
If a market is swinging in a regular rhythm, its filtered price will tend to resemble itself when shifted by one full cycle. Autocorrelation measures exactly that: how well a series correlates with a delayed copy of itself. Measure it at every delay from 0 up to the longest cycle you care about, and you have a fingerprint of the market's rhythm. A Fourier transform of that fingerprint converts it from "similarity at each delay" into "how much power sits at each cycle length", a spectrum. The cycle lengths with the most power are the ones the market is actually doing. This is a public, long-established signal-processing technique that Ehlers adapted for price data.
█ HOW IT IS CALCULATED
1. Pre-filter price with a roofing filter: a two-pole high-pass filter (default cutoff 48 bars) removes trend drift, then a two-pole Super Smoother (default cutoff 10 bars) removes noise.
2. Compute the autocorrelation of the filtered series at each lag from 0 up to the longest cycle searched (default 48), averaging over a few bars (default 3) for stability.
3. Take a discrete Fourier transform of those autocorrelations to get power at each candidate cycle length (default 10 to 48 bars), and smooth it over time.
4. Normalise power against a slowly decaying running maximum.
5. Dominant cycle = the power-weighted average of every cycle length whose normalised power is at or above the dominance threshold (default 0.5). Optionally EMA-smooth the result.
6. Cycle strength = the highest current power divided by the running maximum, from 0 to 1.
7. Classify: below the strength threshold = No Clear Cycle; otherwise Short, Medium or Long by the dominant cycle length against two configurable boundaries (defaults 20 and 34 bars).
Everything updates ONLY on confirmed bar close. The plot, background and table update together on closed bars, so nothing flips mid-bar.
█ SETTINGS & CONFIGURATION
• Source (default close)
• High-Pass / Low-Pass Cutoffs for the pre-filter (defaults 48 / 10)
• Shortest / Longest Cycle Searched (defaults 10 / 48 bars). A larger longest-cycle value costs more computation
• Correlation Averaging (default 3 bars) and Dominance Threshold (default 0.5)
• Output Smoothing (default 3 bars)
• Clear-Cycle Strength (default 0.6) and the Short/Medium and Medium/Long boundaries
• Table position, band colours, pane background and optional main-chart background tint are all configurable
█ HOW TO USE IT
Use it to choose lookback lengths for your other tools from evidence rather than habit. If the dominant cycle is running near 24 bars, indicators tuned to that rhythm tend to behave better than ones tuned far from it. A rising dominant-cycle line means the market's swings are lengthening; a falling one means they are speeding up. Give the strength reading as much weight as the length itself: when the line is grey, the market is not showing a clear rhythm and the length should be disregarded, not trusted.
Works on any asset and timeframe; lengths are in bars, so the same reading means different clock time on different timeframes.
█ LIMITATIONS
• A dominant-cycle estimate only means something when a cycle exists. In trending or random-looking stretches the spectrum has no clear peak and the reported length wanders. That is exactly what the cycle-strength reading and the No Clear Cycle band are for.
• It measures the market's recent rhythm. It does NOT forecast when the next turn will occur.
• Resolution is coarser at longer periods: a 40-bar cycle is harder to pin to the exact bar than a 15-bar cycle.
• Only cycles inside the search range can be reported. Cycles shorter than the minimum or longer than the maximum are invisible to it.
• The roofing pre-filter adds a small, unavoidable lag.
• It needs a long warm-up (about two high-pass cutoffs plus the longest cycle searched) before the reading is trustworthy, so the plot starts well after the first bar on a new chart.
• The strength and boundary thresholds are sensible starting points, not universal constants; adjust them to the market you trade.
• Four states are a deliberate simplification of a continuous reality.
• Everything updates on confirmed bar close only. This script does NOT repaint.
█ DISCLAIMER
For educational and informational purposes only. Nothing here is financial advice. Past behaviour of any cycle state does not indicate future results. Trade at your own risk.
────────────────────────────────────────────────────────────────────

Wyłączenie odpowiedzialności
Informacje i publikacje nie stanowią i nie powinny być traktowane jako porady finansowe, inwestycyjne, tradingowe ani jakiekolwiek inne rekomendacje dostarczane lub zatwierdzone przez TradingView. Więcej informacji znajduje się w Warunkach użytkowania.
Wyłączenie odpowiedzialności
Informacje i publikacje nie stanowią i nie powinny być traktowane jako porady finansowe, inwestycyjne, tradingowe ani jakiekolwiek inne rekomendacje dostarczane lub zatwierdzone przez TradingView. Więcej informacji znajduje się w Warunkach użytkowania.