OPEN-SOURCE SCRIPT
Zaktualizowano Volume Expansion Breakout Planner [AGPro Series]
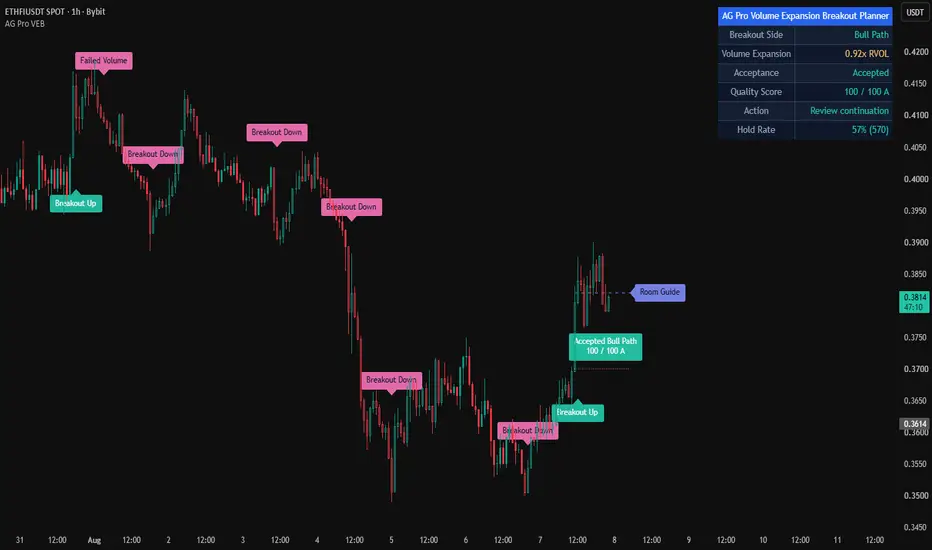
Volume Expansion Breakout Planner [AGPro Series]
🧠 Core Idea
After a breakout, is volume expanding in a constructive path, or is the move losing participation and acceptance?
📌 Overview / What it does
Volume Expansion Breakout Planner [AGPro Series] is a chart-first breakout planning tool built around post-breakout participation quality.
Instead of judging only the breakout candle, the script maps the broken reference level, draws an acceptance band, monitors relative volume after the break, tracks whether price holds the path, and converts the full sequence into a 0-100 quality score.
The output includes compact breakout path labels, volume expansion labels, hold labels, failed-volume labels, an invalidation rail, a room or review guide, and a clean AGPro decision panel. It does not predict price, automate entries, or issue trade commands.
🎯 Purpose & Design Philosophy
This script was built to fill the gap between simple breakout markers and full trade-management tools.
Many breakouts look strong on the first candle but quickly lose participation. Others start quietly and become stronger as post-break volume expands. This tool is designed for traders who want to evaluate that path with structure, not emotion.
The mindset is planning-first: identify the breakout reference, evaluate volume expansion, check acceptance, respect invalidation, and decide whether the path deserves continued attention.
⚡ Why This Script Is Different
Most breakout tools focus on the first break beyond a level.
This script does NOT try to clone a standard breakout volume confirmation tool, a Darvas breakout system, a triangle breakout scanner, or a generic support/resistance map.
Instead, it focuses on the post-break volume expansion path: what happens after the level breaks, whether volume remains constructive, whether price accepts the broken area, and whether the path becomes suspicious or failed.
⚙️ Methodology
1. Context Detection
The script builds a prior price structure from a configurable lookback and identifies the upper and lower breakout references.
2. Reference Mapping
When price closes beyond the reference by an ATR-normalized buffer, the script starts a breakout path and draws the broken level, acceptance band, invalidation rail, and a room or review guide.
3. Reaction Evaluation
The model evaluates relative volume, candle efficiency, close location, breakout distance, trend alignment, range quality, post-break participation, progress, acceptance, and failure behavior.
4. Visual Output
The chart displays compact path labels, volume expansion labels, accepted-path labels, failed-volume labels, and a premium AGPro panel summarizing the current decision state.
🗺️ How to Read the Chart
Zones = the acceptance band around the broken level. Its text changes by state, such as BULL PATH REVIEW, ACCEPTED BULL PATH, or FAILED BEAR PATH.
Labels = compact path state markers such as UP, DN, VOL+, HOLD, FAIL, WATCH UP, and WATCH DN. Label scores can be enabled from settings if the user wants more detail.
Colors = teal for constructive bullish paths, pink for constructive bearish paths, yellow for watch or caution states, indigo for room or review guide emphasis, and muted gray for expired paths.
Panel = the current breakout side, volume expansion state, acceptance state, quality score, and next action.
🚦 Signals & States
• UP → a bullish breakout path has started.
• DN → a bearish breakout path has started.
• VOL+ → post-break volume is expanding with directional follow-through.
• HOLD → the path held beyond the acceptance band with constructive volume.
• FAIL → the path returned into weak-volume or invalidation conditions.
• WATCH UP / WATCH DN → optional approach labels when price is near a breakout reference while relative volume is building.
🔔 Alerts Logic
Alerts trigger when a high-quality bullish or bearish volume expansion path starts, when post-break volume expands, when the path becomes accepted, or when failed-volume conditions appear.
These alerts are attention markers for chart review. They are not trade instructions.
🧩 Confluence Logic
The strongest readings usually occur when the breakout closes cleanly beyond the reference, relative volume expands above baseline, candle structure is efficient, trend alignment supports the side, and price later accepts the broken area.
When these conditions align, the quality score improves and the next-action state becomes more constructive.
📊 When to Use
• Breakout continuation review
• Range exits where volume quality matters
• Post-break acceptance monitoring
• Breakouts that need a clear invalidation reference
• Multi-symbol review where traders need fast path-quality comparison
⚠️ When NOT to Use
• Low-liquidity symbols with unreliable volume
• Markets with irregular session volume or distorted feeds
• Extremely choppy periods where every break returns inside the prior structure
• Events driven by abnormal news volatility where technical volume baselines become less stable
🎛️ Key Inputs
• Breakout Lookback → controls the prior structure used for breakout references.
• Break Buffer ATR → defines how far price must close beyond the level.
• Volume Baseline Length → controls the relative volume baseline.
• Expansion RVOL Threshold → defines the required volume expansion for strong pulses.
• Minimum Planner Score → controls how selective the main path states are.
• Acceptance Band ATR → controls the decision zone around the broken level.
• Invalidation Rail ATR → controls the structural failure reference.
• Panel / Label Settings → control location, theme, font size, label scores, optional watch labels, and label density.
🖥️ Interface & Visual Design
The interface is built for fast chart reading.
The acceptance band is the main visual anchor. The breakout line, invalidation rail, and room or review guide create a compact planning map without filling the chart with generic zones. Labels are short, shifted slightly away from the candle, and capped by user settings.
The AGPro panel follows the publication standard with a single merged blue header row containing only the script name.
🧪 Practical Usage Workflow
1. Read the panel to see whether a breakout path is active.
2. Check the acceptance band and broken level.
3. Evaluate whether volume is expanding or fading.
4. Watch for ACCEPTED or FAILED VOL states.
5. Use the invalidation rail and room or review guide as planning references within broader market context.
🔍 Interpretation Guidelines
Read the score as a structured quality model, not as certainty.
A higher score means the path has cleaner participation, stronger candle structure, better close quality, better trend alignment, and stronger acceptance behavior according to the script's rules.
A lower score means the path is weaker, less accepted, or more vulnerable to failed-volume behavior.
🚫 What This Script Is NOT
• Not a prediction engine
• Not financial advice
• Not auto trading
• Not guaranteed signals
• Not a complete trading system
• Not a generic buy/sell indicator
⚠️ Limitations & Transparency
Volume quality depends on the reliability of the TradingView volume feed for the selected symbol.
Different timeframes can produce different breakout references and acceptance behavior.
High-volatility news periods, low-liquidity markets, and irregular session activity can reduce the usefulness of relative volume baselines.
The script is rule-based and should be interpreted alongside broader context.
🧠 Market Context Notes
Volume expansion is most useful when it is connected to structure.
The broken level matters because it gives the move a reference. The acceptance band matters because it shows whether the market is holding that reference. The invalidation rail matters because it defines when the path has lost structural quality.
🧾 Use Case Examples
When price breaks above a prior range with strong RVOL and later holds the acceptance band, the path may remain constructive.
When price breaks below a range but volume fades and price returns above the broken reference, the path may become suspicious or failed.
When price approaches a reference with building volume but no confirmed break, VOL WATCH keeps the trader aware without turning the tool into a signal board.
🧱 System Philosophy
The script is part of the AGPro planner-style workflow: show the reference, score the context, define invalidation, monitor acceptance, and guide the next review step.
🔐 Non-Promise Statement
No script can guarantee continuation, reversal, or outcome certainty.
This tool organizes breakout-volume context so users can evaluate the chart more clearly.
📉 Risk Disclosure
Trading involves risk.
Users are responsible for their own decisions, risk management, and market interpretation.
This script is provided for educational and analytical use only and does not provide financial advice.
📚 Educational Note
Use the script to study how post-breakout volume behaves after price leaves a prior structure. The most useful insights often come from comparing accepted paths against failed-volume paths over many examples.
🧠 Core Idea
After a breakout, is volume expanding in a constructive path, or is the move losing participation and acceptance?
📌 Overview / What it does
Volume Expansion Breakout Planner [AGPro Series] is a chart-first breakout planning tool built around post-breakout participation quality.
Instead of judging only the breakout candle, the script maps the broken reference level, draws an acceptance band, monitors relative volume after the break, tracks whether price holds the path, and converts the full sequence into a 0-100 quality score.
The output includes compact breakout path labels, volume expansion labels, hold labels, failed-volume labels, an invalidation rail, a room or review guide, and a clean AGPro decision panel. It does not predict price, automate entries, or issue trade commands.
🎯 Purpose & Design Philosophy
This script was built to fill the gap between simple breakout markers and full trade-management tools.
Many breakouts look strong on the first candle but quickly lose participation. Others start quietly and become stronger as post-break volume expands. This tool is designed for traders who want to evaluate that path with structure, not emotion.
The mindset is planning-first: identify the breakout reference, evaluate volume expansion, check acceptance, respect invalidation, and decide whether the path deserves continued attention.
⚡ Why This Script Is Different
Most breakout tools focus on the first break beyond a level.
This script does NOT try to clone a standard breakout volume confirmation tool, a Darvas breakout system, a triangle breakout scanner, or a generic support/resistance map.
Instead, it focuses on the post-break volume expansion path: what happens after the level breaks, whether volume remains constructive, whether price accepts the broken area, and whether the path becomes suspicious or failed.
⚙️ Methodology
1. Context Detection
The script builds a prior price structure from a configurable lookback and identifies the upper and lower breakout references.
2. Reference Mapping
When price closes beyond the reference by an ATR-normalized buffer, the script starts a breakout path and draws the broken level, acceptance band, invalidation rail, and a room or review guide.
3. Reaction Evaluation
The model evaluates relative volume, candle efficiency, close location, breakout distance, trend alignment, range quality, post-break participation, progress, acceptance, and failure behavior.
4. Visual Output
The chart displays compact path labels, volume expansion labels, accepted-path labels, failed-volume labels, and a premium AGPro panel summarizing the current decision state.
🗺️ How to Read the Chart
Zones = the acceptance band around the broken level. Its text changes by state, such as BULL PATH REVIEW, ACCEPTED BULL PATH, or FAILED BEAR PATH.
Labels = compact path state markers such as UP, DN, VOL+, HOLD, FAIL, WATCH UP, and WATCH DN. Label scores can be enabled from settings if the user wants more detail.
Colors = teal for constructive bullish paths, pink for constructive bearish paths, yellow for watch or caution states, indigo for room or review guide emphasis, and muted gray for expired paths.
Panel = the current breakout side, volume expansion state, acceptance state, quality score, and next action.
🚦 Signals & States
• UP → a bullish breakout path has started.
• DN → a bearish breakout path has started.
• VOL+ → post-break volume is expanding with directional follow-through.
• HOLD → the path held beyond the acceptance band with constructive volume.
• FAIL → the path returned into weak-volume or invalidation conditions.
• WATCH UP / WATCH DN → optional approach labels when price is near a breakout reference while relative volume is building.
🔔 Alerts Logic
Alerts trigger when a high-quality bullish or bearish volume expansion path starts, when post-break volume expands, when the path becomes accepted, or when failed-volume conditions appear.
These alerts are attention markers for chart review. They are not trade instructions.
🧩 Confluence Logic
The strongest readings usually occur when the breakout closes cleanly beyond the reference, relative volume expands above baseline, candle structure is efficient, trend alignment supports the side, and price later accepts the broken area.
When these conditions align, the quality score improves and the next-action state becomes more constructive.
📊 When to Use
• Breakout continuation review
• Range exits where volume quality matters
• Post-break acceptance monitoring
• Breakouts that need a clear invalidation reference
• Multi-symbol review where traders need fast path-quality comparison
⚠️ When NOT to Use
• Low-liquidity symbols with unreliable volume
• Markets with irregular session volume or distorted feeds
• Extremely choppy periods where every break returns inside the prior structure
• Events driven by abnormal news volatility where technical volume baselines become less stable
🎛️ Key Inputs
• Breakout Lookback → controls the prior structure used for breakout references.
• Break Buffer ATR → defines how far price must close beyond the level.
• Volume Baseline Length → controls the relative volume baseline.
• Expansion RVOL Threshold → defines the required volume expansion for strong pulses.
• Minimum Planner Score → controls how selective the main path states are.
• Acceptance Band ATR → controls the decision zone around the broken level.
• Invalidation Rail ATR → controls the structural failure reference.
• Panel / Label Settings → control location, theme, font size, label scores, optional watch labels, and label density.
🖥️ Interface & Visual Design
The interface is built for fast chart reading.
The acceptance band is the main visual anchor. The breakout line, invalidation rail, and room or review guide create a compact planning map without filling the chart with generic zones. Labels are short, shifted slightly away from the candle, and capped by user settings.
The AGPro panel follows the publication standard with a single merged blue header row containing only the script name.
🧪 Practical Usage Workflow
1. Read the panel to see whether a breakout path is active.
2. Check the acceptance band and broken level.
3. Evaluate whether volume is expanding or fading.
4. Watch for ACCEPTED or FAILED VOL states.
5. Use the invalidation rail and room or review guide as planning references within broader market context.
🔍 Interpretation Guidelines
Read the score as a structured quality model, not as certainty.
A higher score means the path has cleaner participation, stronger candle structure, better close quality, better trend alignment, and stronger acceptance behavior according to the script's rules.
A lower score means the path is weaker, less accepted, or more vulnerable to failed-volume behavior.
🚫 What This Script Is NOT
• Not a prediction engine
• Not financial advice
• Not auto trading
• Not guaranteed signals
• Not a complete trading system
• Not a generic buy/sell indicator
⚠️ Limitations & Transparency
Volume quality depends on the reliability of the TradingView volume feed for the selected symbol.
Different timeframes can produce different breakout references and acceptance behavior.
High-volatility news periods, low-liquidity markets, and irregular session activity can reduce the usefulness of relative volume baselines.
The script is rule-based and should be interpreted alongside broader context.
🧠 Market Context Notes
Volume expansion is most useful when it is connected to structure.
The broken level matters because it gives the move a reference. The acceptance band matters because it shows whether the market is holding that reference. The invalidation rail matters because it defines when the path has lost structural quality.
🧾 Use Case Examples
When price breaks above a prior range with strong RVOL and later holds the acceptance band, the path may remain constructive.
When price breaks below a range but volume fades and price returns above the broken reference, the path may become suspicious or failed.
When price approaches a reference with building volume but no confirmed break, VOL WATCH keeps the trader aware without turning the tool into a signal board.
🧱 System Philosophy
The script is part of the AGPro planner-style workflow: show the reference, score the context, define invalidation, monitor acceptance, and guide the next review step.
🔐 Non-Promise Statement
No script can guarantee continuation, reversal, or outcome certainty.
This tool organizes breakout-volume context so users can evaluate the chart more clearly.
📉 Risk Disclosure
Trading involves risk.
Users are responsible for their own decisions, risk management, and market interpretation.
This script is provided for educational and analytical use only and does not provide financial advice.
📚 Educational Note
Use the script to study how post-breakout volume behaves after price leaves a prior structure. The most useful insights often come from comparing accepted paths against failed-volume paths over many examples.
Informacje o Wersji
🔧 UPDATE NOTES - V1.1This update focuses on readability, visual structure, and publication usability.
The core purpose of the script remains unchanged.
This release improves how the existing breakout expansion logic is presented, organized, and interpreted on the chart.
This script continues to function as an analytical and visualization tool.
It does not attempt to predict price direction or provide guaranteed outcomes.
------------------------
What Changed
------------------------
• Added a separate centered zone badge
The acceptance band now uses a dedicated centered badge instead of relying on embedded zone text. This improves readability across dark and light chart themes.
• Added Zone Badge Anchor control
Users can adjust where the centered acceptance badge appears inside the projected breakout path.
• Refined chart label wording
Short labels such as UP, DN, HOLD, and FAIL were replaced with clearer publication-style labels such as Breakout Up, Volume Expansion, Accepted, and Failed Volume.
• Expanded panel location controls
The panel now supports Middle Center in addition to the previous top, middle, and bottom placement options.
• Added Slate theme and Huge font-size support
Panel and label controls now provide more presentation flexibility while preserving the AG Pro visual identity.
------------------------
Visual Improvements
------------------------
• Improved chart readability by separating zone fill from zone text
• Reduced the chance of text blending into transparent boxes
• Refined visual hierarchy so the acceptance band, guide rail, and event labels are easier to interpret
• Adjusted default label offset slightly to keep labels away from candles
------------------------
Interface & Usability
------------------------
• Optimized panel location flexibility for more chart layouts
• Improved label readability for better first-glance interpretation
• Added more font-size control for labels, zone badges, and panel text
• Enhanced overall user experience without changing the core breakout-path logic
------------------------
Behavior Notes
------------------------
This update does not change the core analytical logic of the script.
The goal is to improve clarity and usability, not to introduce new predictive behavior.
Users should interpret outputs the same way as before, but with improved visual structure.
------------------------
Limitations Reminder
------------------------
The script remains a rule-based analytical tool.
Market conditions such as volatility, liquidity, and timeframe differences may affect how signals appear.
Outputs should always be interpreted within broader market context.
------------------------
Risk Reminder
------------------------
This script is for educational and analytical purposes only.
It does not provide financial advice or guaranteed trading outcomes.
Users remain responsible for their own decisions.
Informacje o Wersji
🔧 UPDATE NOTES - 1.2This update adds a hold-rate proof layer and contrast-safe label text to the Volume
Expansion Breakout Planner. The core breakout-path engine, scoring and rails remain
unchanged. This script continues to function as an analytical visualization tool.
It does not predict price direction or provide guaranteed outcomes.
------------------------
What Changed
------------------------
- Hold-Rate Proof Layer
The panel now tracks how often a fresh breakout path held without closing through
its invalidation rail inside a defined window, with sample size shown.
- Thesis-Aligned Statistic
The proof reflects the script's core idea - a breakout that holds its structure
versus one that is given back - by measuring the invalidation rail, rather than
distant target behavior.
- Honest, Non-Repaint Statistics
Each breakout path is counted once. Samples are confirmed-bar gated, closing
through the invalidation rail inside the window counts as a non-hold, and the rate
is built from completed windows only so it is not inflated.
- Contrast-Safe Label Text
A luminance helper now sets label, badge and guide text color automatically, so
amber, pink and indigo elements stay clearly readable.
- New Proof Input
A dedicated proof group adds Proof Hold Window Bars so the hold test can be tuned
per market and timeframe.
------------------------
Visual Improvements
------------------------
- Improved label and zone-badge readability through automatic text contrast
- Kept the premium acceptance band, centered badge, level, invalidation and path
guides intact
- Preserved moderate, non-overlapping label density
- No added chart clutter from the proof layer
------------------------
Interface & Usability
------------------------
- Added a Hold Rate proof row to the decision panel
- Improved first-glance trust with a visible track-record context
- Kept all existing settings and defaults backward compatible
- Enhanced overall experience without changing the core engine
------------------------
Behavior Notes
------------------------
This update does not change how breakouts, the acceptance band, expansion,
acceptance, failure or the score are computed. The goal is added proof context and
cleaner text contrast. Outputs should be interpreted the same way as before.
------------------------
Limitations Reminder
------------------------
The script remains a rule-based analytical tool. Volatility, liquidity and
timeframe differences can affect how breakouts, paths and statistics appear.
Always interpret outputs within broader market context.
------------------------
Risk Reminder
------------------------
This script is for educational and analytical purposes only. It does not provide
financial advice or guaranteed trading outcomes. Users remain responsible for
their own decisions.
Informacje o Wersji
Version 1.3 – Event-Label Collision Control and Chart ReadabilityThis update improves event-label spacing during rapid breakout-path changes while preserving the planner's existing breakout detection, volume-expansion model, acceptance logic, quality scoring, hold-rate statistics, zones, guides, and alerts.
• Added a bounded label-lane system that detects recent labels placed on the same side of price and assigns a progressively separated ATR-based visual lane.
• Applied the collision control consistently to breakout, volume-expansion, acceptance, failed-volume, and optional volume-watch labels.
• Added an adjustable Label Lane Spacing ATR input so users can tune vertical separation without changing signal frequency or analytical behavior.
• Preserved the existing label cooldown and maximum-label limits, maintaining useful chart density while preventing rapid opposite paths from stacking text over the same candle cluster.
• Kept the acceptance-band badge centered inside its zone and retained the labeled Room Guide or Review Guide on its corresponding projection line.
• Kept the core analytical model unchanged. This release refines visual placement only and does not add predictive behavior or guaranteed outcomes.
Skrypt open-source
W zgodzie z duchem TradingView twórca tego skryptu udostępnił go jako open-source, aby użytkownicy mogli przejrzeć i zweryfikować jego działanie. Ukłony dla autora. Korzystanie jest bezpłatne, jednak ponowna publikacja kodu podlega naszym Zasadom serwisu.

Trading Suite | Flagship Workflow :
tradingview.com/script/XJmX3p98-Trading-Suite-AGPro-Series/
Crypto Setup Planner | Multi-Symbol Analysis :
tradingview.com/script/LgVRo7Ql-Crypto-Setup-Planner-AGPro-Series/
tradingview.com/script/XJmX3p98-Trading-Suite-AGPro-Series/
Crypto Setup Planner | Multi-Symbol Analysis :
tradingview.com/script/LgVRo7Ql-Crypto-Setup-Planner-AGPro-Series/
Wyłączenie odpowiedzialności
Informacje i publikacje nie stanowią i nie powinny być traktowane jako porady finansowe, inwestycyjne, tradingowe ani jakiekolwiek inne rekomendacje dostarczane lub zatwierdzone przez TradingView. Więcej informacji znajduje się w Warunkach użytkowania.
Skrypt open-source
W zgodzie z duchem TradingView twórca tego skryptu udostępnił go jako open-source, aby użytkownicy mogli przejrzeć i zweryfikować jego działanie. Ukłony dla autora. Korzystanie jest bezpłatne, jednak ponowna publikacja kodu podlega naszym Zasadom serwisu.
Trading Suite | Flagship Workflow :
tradingview.com/script/XJmX3p98-Trading-Suite-AGPro-Series/
Crypto Setup Planner | Multi-Symbol Analysis :
tradingview.com/script/LgVRo7Ql-Crypto-Setup-Planner-AGPro-Series/
tradingview.com/script/XJmX3p98-Trading-Suite-AGPro-Series/
Crypto Setup Planner | Multi-Symbol Analysis :
tradingview.com/script/LgVRo7Ql-Crypto-Setup-Planner-AGPro-Series/
Wyłączenie odpowiedzialności
Informacje i publikacje nie stanowią i nie powinny być traktowane jako porady finansowe, inwestycyjne, tradingowe ani jakiekolwiek inne rekomendacje dostarczane lub zatwierdzone przez TradingView. Więcej informacji znajduje się w Warunkach użytkowania.