Stochastic Momentum Index [MiesOnCharts]
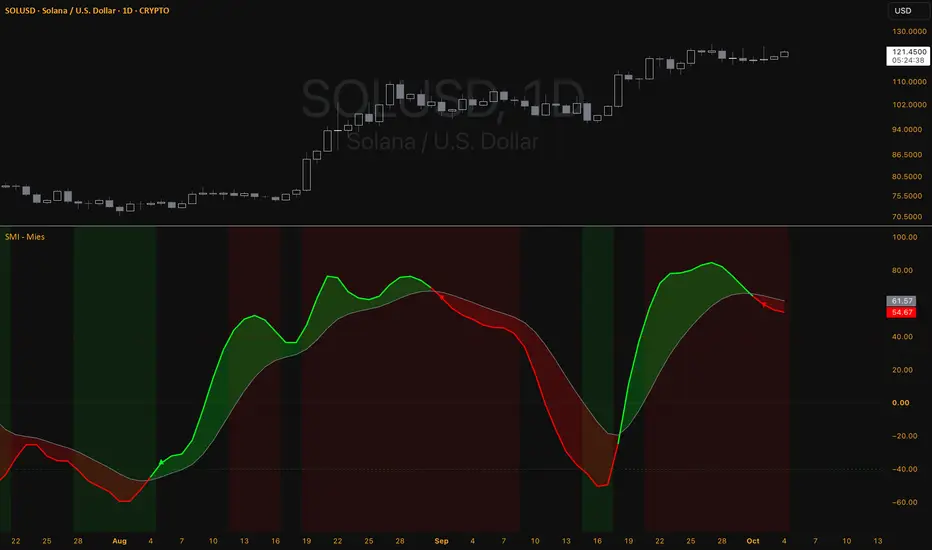
A smoother William Blau's Stochastic Momentum Index.
What it measures
Where the close sits against the middle of the recent high to low range, scaled from -100 to +100. Zero is a close at the middle of the range, +100 a close pinned to its top, -100 to its bottom.
A plain stochastic divides by the range on every bar, so in a tight range it swings from one end to the other. The SMI smooths the distance and the range separately before dividing them.
What is different here
- Blau smoothed both parts with two EMAs each. This version uses one Ehlers SuperSmoother on each.
- A cross buffer. The line only changes side once the SMI is clearly past its signal line, so it does not flip every time the two lines touch.
- Signals fire on the close. The line moves with price while a bar is forming, but markers and alerts only fire once the bar has closed.
How to read it
- Green line: the SMI is above its signal line and momentum is rising. Red: below it and momentum is falling.
- Shaded background: the SMI is beyond the overbought or oversold level.
- Triangles: a turn made while the signal line is beyond one of those levels. A turn down from overbought or up from oversold is the classic SMI signal.
- Optional candle colouring follows the same green and red.
Settings
- Range Length: how many bars the high to low range covers. Longer gives a steadier, slower line.
- Smoothing: the SuperSmoother period. Longer is quieter and slower.
- Signal Length: the EMA of the SMI drawn as the signal line.
- Cross Buffer: how far past the signal line the SMI has to get before the line changes side. Zero changes side on every cross.
- Overbought and Oversold: the levels used for the shading and the triangles.
Alerts
Turned up, turned down, turned up in oversold and turned down in overbought. All fire on the bar close.
Notes
Like any oscillator, it describes momentum that has already happened. Overbought and oversold are not reversal calls on their own; in a strong trend the SMI can stay at an extreme for a long time.
Credits
The Stochastic Momentum Index is William Blau's. The SuperSmoother is John Ehlers'.
For educational purposes only. Not financial advice.
What it measures
Where the close sits against the middle of the recent high to low range, scaled from -100 to +100. Zero is a close at the middle of the range, +100 a close pinned to its top, -100 to its bottom.
A plain stochastic divides by the range on every bar, so in a tight range it swings from one end to the other. The SMI smooths the distance and the range separately before dividing them.
What is different here
- Blau smoothed both parts with two EMAs each. This version uses one Ehlers SuperSmoother on each.
- A cross buffer. The line only changes side once the SMI is clearly past its signal line, so it does not flip every time the two lines touch.
- Signals fire on the close. The line moves with price while a bar is forming, but markers and alerts only fire once the bar has closed.
How to read it
- Green line: the SMI is above its signal line and momentum is rising. Red: below it and momentum is falling.
- Shaded background: the SMI is beyond the overbought or oversold level.
- Triangles: a turn made while the signal line is beyond one of those levels. A turn down from overbought or up from oversold is the classic SMI signal.
- Optional candle colouring follows the same green and red.
Settings
- Range Length: how many bars the high to low range covers. Longer gives a steadier, slower line.
- Smoothing: the SuperSmoother period. Longer is quieter and slower.
- Signal Length: the EMA of the SMI drawn as the signal line.
- Cross Buffer: how far past the signal line the SMI has to get before the line changes side. Zero changes side on every cross.
- Overbought and Oversold: the levels used for the shading and the triangles.
Alerts
Turned up, turned down, turned up in oversold and turned down in overbought. All fire on the bar close.
Notes
Like any oscillator, it describes momentum that has already happened. Overbought and oversold are not reversal calls on their own; in a strong trend the SMI can stay at an extreme for a long time.
Credits
The Stochastic Momentum Index is William Blau's. The SuperSmoother is John Ehlers'.
For educational purposes only. Not financial advice.

Wyłączenie odpowiedzialności
Informacje i publikacje nie stanowią i nie powinny być traktowane jako porady finansowe, inwestycyjne, tradingowe ani jakiekolwiek inne rekomendacje dostarczane lub zatwierdzone przez TradingView. Więcej informacji znajduje się w Warunkach użytkowania.
Wyłączenie odpowiedzialności
Informacje i publikacje nie stanowią i nie powinny być traktowane jako porady finansowe, inwestycyjne, tradingowe ani jakiekolwiek inne rekomendacje dostarczane lub zatwierdzone przez TradingView. Więcej informacji znajduje się w Warunkach użytkowania.