Initial Balance Stats
Initial Balance Stats
WHAT IT DOES
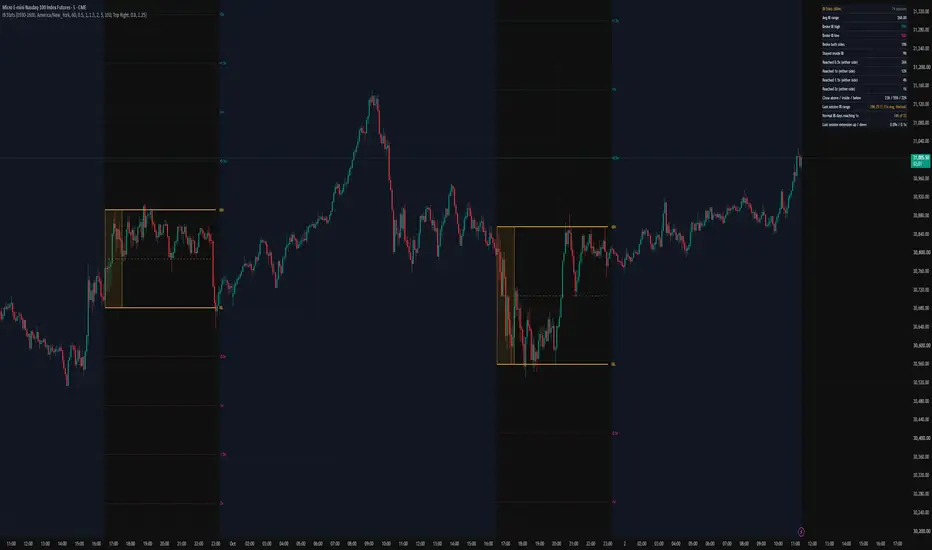
This indicator draws the Initial Balance (IB) of each session with its extension levels, and adds a statistics table that shows how price has historically behaved around the IB on this instrument: how often it breaks each side, how far it extends, and where the session closes.
DEFINITIONS
- Initial Balance: the high and low of the first part of the session. Default: the first 60 minutes of the New York cash session (09:30 to 10:30 New York time).
- Extensions: levels beyond the IB high and low, measured as a multiple of the IB range. Defaults are 0.5x, 1x, 1.5x and 2x. Note: a 0.5x extension here is what is often called a "1.5x IB" day.
ON THE CHART
- The IB window is shaded, and the IB high and low are extended to the end of the session, with the IB midpoint as a dashed line.
- Upside extensions are drawn above the IB high, downside extensions below the IB low.
- Only the most recent sessions are drawn (5 by default) to keep the chart clean.
STATISTICS TABLE
Calculated over the last completed sessions (100 by default). The current session is only added once it is complete.
- Broke IB high / Broke IB low / Broke both sides / Stayed inside IB
- Reached each extension (on either side)
- Session close above, inside or below the IB
- Current or last session: IB range compared with the average, classified as Narrow, Normal or Wide
- Conditional stat: how often past sessions with a similar IB size (Narrow, Normal or Wide) reached the second extension (1x by default)
- How far the current or last session has extended so far, up and down
ALERTS
- IB high broken: first break above the IB high in a session
- IB low broken: first break below the IB low in a session
SETTINGS
- Session, timezone and IB length (15, 30, 60 or 90 minutes)
- The four extension multiples
- Number of sessions to draw, lookback for statistics, Narrow / Wide thresholds, table position
REQUIREMENTS
- Use an intraday chart whose bars line up with the session start. For a 09:30 start, use 30m, 15m, 5m or lower. Timeframes that cannot open a bar at the session start (for example 1H) show an error instead of producing shifted levels.
- Sessions whose first bar does not open at the session start (for example because of a data gap) are skipped and counted in the table.
LIMITATIONS
- The number of sessions in the statistics depends on how much history the chart loads. Higher timeframes (15m or 30m) give a larger sample. The table shows how many sessions were actually used.
- Extensions are measured from the highs and lows made after the IB period, within the same session.
- Holidays and shortened sessions are included as they are.
- Statistics describe past behavior on the chosen instrument and session. They are not a forecast and do not guarantee future results.
This script is for chart analysis and education only. It is not a trading signal and does not provide financial advice.
WHAT IT DOES
This indicator draws the Initial Balance (IB) of each session with its extension levels, and adds a statistics table that shows how price has historically behaved around the IB on this instrument: how often it breaks each side, how far it extends, and where the session closes.
DEFINITIONS
- Initial Balance: the high and low of the first part of the session. Default: the first 60 minutes of the New York cash session (09:30 to 10:30 New York time).
- Extensions: levels beyond the IB high and low, measured as a multiple of the IB range. Defaults are 0.5x, 1x, 1.5x and 2x. Note: a 0.5x extension here is what is often called a "1.5x IB" day.
ON THE CHART
- The IB window is shaded, and the IB high and low are extended to the end of the session, with the IB midpoint as a dashed line.
- Upside extensions are drawn above the IB high, downside extensions below the IB low.
- Only the most recent sessions are drawn (5 by default) to keep the chart clean.
STATISTICS TABLE
Calculated over the last completed sessions (100 by default). The current session is only added once it is complete.
- Broke IB high / Broke IB low / Broke both sides / Stayed inside IB
- Reached each extension (on either side)
- Session close above, inside or below the IB
- Current or last session: IB range compared with the average, classified as Narrow, Normal or Wide
- Conditional stat: how often past sessions with a similar IB size (Narrow, Normal or Wide) reached the second extension (1x by default)
- How far the current or last session has extended so far, up and down
ALERTS
- IB high broken: first break above the IB high in a session
- IB low broken: first break below the IB low in a session
SETTINGS
- Session, timezone and IB length (15, 30, 60 or 90 minutes)
- The four extension multiples
- Number of sessions to draw, lookback for statistics, Narrow / Wide thresholds, table position
REQUIREMENTS
- Use an intraday chart whose bars line up with the session start. For a 09:30 start, use 30m, 15m, 5m or lower. Timeframes that cannot open a bar at the session start (for example 1H) show an error instead of producing shifted levels.
- Sessions whose first bar does not open at the session start (for example because of a data gap) are skipped and counted in the table.
LIMITATIONS
- The number of sessions in the statistics depends on how much history the chart loads. Higher timeframes (15m or 30m) give a larger sample. The table shows how many sessions were actually used.
- Extensions are measured from the highs and lows made after the IB period, within the same session.
- Holidays and shortened sessions are included as they are.
- Statistics describe past behavior on the chosen instrument and session. They are not a forecast and do not guarantee future results.
This script is for chart analysis and education only. It is not a trading signal and does not provide financial advice.

Wyłączenie odpowiedzialności
Informacje i publikacje nie stanowią i nie powinny być traktowane jako porady finansowe, inwestycyjne, tradingowe ani jakiekolwiek inne rekomendacje dostarczane lub zatwierdzone przez TradingView. Więcej informacji znajduje się w Warunkach użytkowania.
Wyłączenie odpowiedzialności
Informacje i publikacje nie stanowią i nie powinny być traktowane jako porady finansowe, inwestycyjne, tradingowe ani jakiekolwiek inne rekomendacje dostarczane lub zatwierdzone przez TradingView. Więcej informacji znajduje się w Warunkach użytkowania.