OPEN-SOURCE SCRIPT
Rang Birangi RSI + Trend
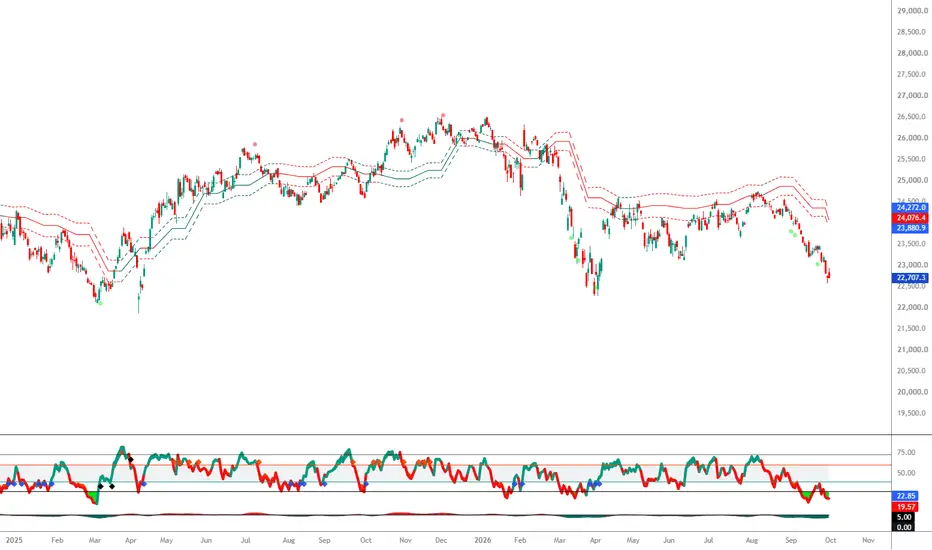
======================================================================
RANG BIRANGI RSI + TREND — BUY / SELL SIGNALS & RISK EXPLAINED
(c) TGP_Analysis | Pine Script v6
======================================================================
PURPOSE OF THIS NOTE
--------------------
This note explains the actual trade signals in the indicator — the
coloured DIAMONDS — and shows how risk is already defined inside the
signal logic, plus where to place your stop on each trade.
----------------------------------------------------------------------
1. THE TWO RSI LINES (the engine behind everything)
----------------------------------------------------------------------
- RSI 13 (slower) = the baseline / trend of momentum
- RSI 9 (faster) = the trigger line
By default all signals read the FAST line, RSI 9 (the input
"Signal RSI = RSI 9" is ON). RSI 9 is what dips into oversold,
recovers, and fires the signals.
Reference levels used by the signals:
- 40 = Bull trigger (mid line where a recovery is confirmed)
- 60 = Bear trigger (mid line where a breakdown is confirmed)
- 30 / 20 = Oversold TEST levels (shallow / deep)
- 70 / 80 = Overbought TEST levels (shallow / deep)
- Lookback = 20 bars (how recently the test must have happened)
----------------------------------------------------------------------
2. BUY SIGNAL (GREEN DIAMOND) — logic in plain words
----------------------------------------------------------------------
A buy is a two-stage event. BOTH stages must happen:
STAGE 1 — THE TEST (fear / washout):
Within the last 20 bars, RSI 9 fell to an oversold extreme:
* touched 30 = shallow test
* touched 20 = deep test (stronger washout)
STAGE 2 — THE RECOVERY (confirmation):
RSI 9 then turns up AND crosses back above 40,
while it is actually rising (this bar > last bar).
Only when the recovery crosses 40 does the diamond print.
TWO GRADES OF BUY:
- Light green diamond (plotted at RSI 37) = "Bull 30-test"
Price washed out to the 30 zone, then recovered. Milder.
- Bright green diamond (plotted at RSI 34) = "Bull 20-test"
Price washed out all the way to 20, then recovered.
Deeper fear flushed out = higher-conviction buy.
Think of it as: the market got scared, sellers exhausted
themselves (the test), and buyers took control back (the cross
above 40). You are NOT catching a falling knife — you wait for
the turn to confirm.
----------------------------------------------------------------------
3. SELL SIGNAL (RED / ORANGE DIAMOND) — logic in plain words
----------------------------------------------------------------------
Mirror image of the buy. Two stages:
STAGE 1 — THE TEST (greed / blow-off):
Within the last 20 bars, RSI 9 pushed to an overbought
extreme:
* touched 70 = shallow test
* touched 80 = deep test (stronger blow-off)
STAGE 2 — THE ROLL-OVER (confirmation):
RSI 9 then turns down AND crosses back below 60,
while it is actually falling.
TWO GRADES OF SELL:
- Orange diamond (plotted at RSI 63) = "Bear 70-test"
Milder overbought, then roll-over.
- Bright red diamond (plotted at RSI 66) = "Bear 80-test"
Extreme overbought (80), then roll-over.
Higher-conviction sell / exit.
Think of it as: the market got greedy, buyers exhausted
themselves (the test), sellers took control back (the cross
below 60).
----------------------------------------------------------------------
4. HOW RISK IS ALREADY "DEFINED" INSIDE THE SIGNAL
----------------------------------------------------------------------
The signal is deliberately built to reduce entry risk BEFORE you
even place a stop:
(a) IT WAITS FOR CONFIRMATION.
No signal fires at the oversold low itself. It only fires
after RSI turns and reclaims 40 (buy) or loses 60 (sell).
This filters out "it kept falling" scenarios.
(b) IT REQUIRES A RECENT EXTREME.
The 20-bar lookback means the setup must be a genuine
reversal from stretched conditions — not a random mid-range
wiggle.
(c) IT GRADES CONVICTION FOR YOU.
Deep-test diamonds (20 / 80) = size up / trust more.
Shallow-test diamonds (30 / 70) = size down / be selective.
This is position-risk control baked into the colour.
----------------------------------------------------------------------
5. WHERE TO PLACE YOUR STOP (defining the money-risk)
----------------------------------------------------------------------
The signal defines the SETUP; you define the STOP from price.
ON A GREEN (BUY) DIAMOND:
- Stop just below the swing LOW made during the oversold
test (the price low that occurred while RSI was at 30/20).
- That low is your invalidation point: if price trades
below it, the reversal has failed.
- Risk per unit = Entry price - that swing low.
ON A RED (SELL) DIAMOND:
- Stop just above the swing HIGH made during the overbought
test (the price high while RSI was at 70/80).
- Risk per unit = that swing high - Entry price.
TARGET / TRAIL:
- Use the Trend Engine line (the "Trend Line" / avg) and the
Up / Down label as your trail. Stay long while the trend
line is green and price holds above it; stay short while
it is red and price holds below it.
- A deep-test diamond in the OPPOSITE direction is a natural
exit for an existing position.
----------------------------------------------------------------------
6. BEST-PRACTICE FILTER (combine signal + trend)
----------------------------------------------------------------------
Highest-quality trades = signal AGREES with the trend engine:
- BUY diamond + price above the green Trend Line = with-trend
long (strongest).
- SELL diamond + price below the red Trend Line = with-trend
short (strongest).
- A diamond AGAINST the trend line = counter-trend; treat as a
quick mean-reversion / scalp only, tighter stop, smaller size.
Optional extra confirmation already in the tool:
- "Mean Reversion" dots and "Strong Mean Reversion" dots
mark momentum snapping back from an extreme. A buy diamond
landing near an up mean-reversion dot adds confidence.
----------------------------------------------------------------------
7. QUICK REFERENCE TABLE
----------------------------------------------------------------------
SIGNAL RSI TEST CONFIRM CROSS CONVICTION STOP
----------------- ---------- ------------- ---------- -----------------
Bright green dia. touched 20 up through 40 HIGH (buy) below test-low
Light green dia. touched 30 up through 40 MED (buy) below test-low
Bright red dia. touched 80 down thru 60 HIGH (sell) above test-high
Orange dia. touched 70 down thru 60 MED (sell) above test-high
----------------------------------------------------------------------
8. ONE-LINE SUMMARY
----------------------------------------------------------------------
BUY = RSI washed out (30/20), then recovered above 40 -> stop
below the washout low.
SELL = RSI blew off (70/80), then rolled under 60 -> stop
above the blow-off high.
Deeper the test, stronger the signal. Trade in the direction of
the Trend Line for best results.
======================================================================
Skrypt open-source
W zgodzie z duchem TradingView twórca tego skryptu udostępnił go jako open-source, aby użytkownicy mogli przejrzeć i zweryfikować jego działanie. Ukłony dla autora. Korzystanie jest bezpłatne, jednak ponowna publikacja kodu podlega naszym Zasadom serwisu.

Wyłączenie odpowiedzialności
Informacje i publikacje nie stanowią i nie powinny być traktowane jako porady finansowe, inwestycyjne, tradingowe ani jakiekolwiek inne rekomendacje dostarczane lub zatwierdzone przez TradingView. Więcej informacji znajduje się w Warunkach użytkowania.
Skrypt open-source
W zgodzie z duchem TradingView twórca tego skryptu udostępnił go jako open-source, aby użytkownicy mogli przejrzeć i zweryfikować jego działanie. Ukłony dla autora. Korzystanie jest bezpłatne, jednak ponowna publikacja kodu podlega naszym Zasadom serwisu.
Wyłączenie odpowiedzialności
Informacje i publikacje nie stanowią i nie powinny być traktowane jako porady finansowe, inwestycyjne, tradingowe ani jakiekolwiek inne rekomendacje dostarczane lub zatwierdzone przez TradingView. Więcej informacji znajduje się w Warunkach użytkowania.