OPEN-SOURCE SCRIPT
Zaktualizowano ATR + STRAT Dashboard (LAST + DIR + REV) + Est Moves
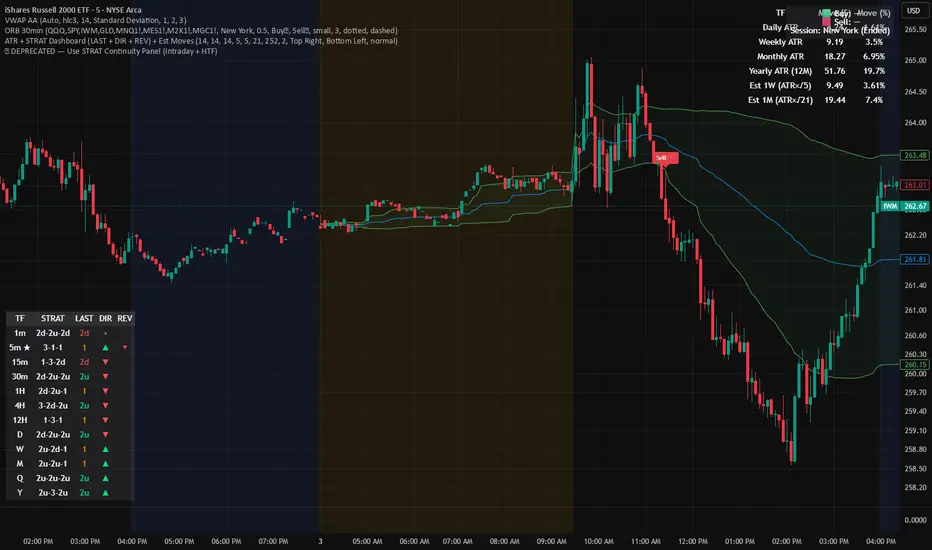
ATR + STRAT Dashboard is a multi-timeframe market structure indicator built around The Strat and ATR context. It summarizes higher-timeframe control (buyers vs sellers), highlights key Strat conditions (inside/outside/2-1-2 style transitions), and flags common reversal candles (hammer / shooting star style signals) to help spot potential turns. It also includes ATR-based context and estimated move guidance so you can quickly gauge whether price has “room” to run or is extended.
What it shows
MTF Dashboard: quick read of trend/control across multiple timeframes
Direction/Control: color-based bias (buyers vs sellers in charge)
Reversal Flags: highlights reversal-style candles for awareness (not guaranteed)
ATR Context + Estimated Moves: volatility-based framework for targets/expectations
Non-repainting HTF behavior: designed to use closed higher-timeframe bars to reduce repaint surprises
Note: This tool is for structure + context, not trade signals by itself. Always confirm with your plan/risk management.
What it shows
MTF Dashboard: quick read of trend/control across multiple timeframes
Direction/Control: color-based bias (buyers vs sellers in charge)
Reversal Flags: highlights reversal-style candles for awareness (not guaranteed)
ATR Context + Estimated Moves: volatility-based framework for targets/expectations
Non-repainting HTF behavior: designed to use closed higher-timeframe bars to reduce repaint surprises
Note: This tool is for structure + context, not trade signals by itself. Always confirm with your plan/risk management.
Informacje o Wersji
⚠️ Deprecated / DiscontinuedThis script is no longer supported. It can show inconsistent multi-timeframe STRAT values depending on chart timeframe/session mapping.
Use the replacements:
STRAT Continuity Panel — Intraday (Extended) (≤4H charts)
STRAT Continuity Panel — HTF (D/W/M/Q/Y) (Daily/Weekly/Monthly)
Skrypt open-source
W zgodzie z duchem TradingView twórca tego skryptu udostępnił go jako open-source, aby użytkownicy mogli przejrzeć i zweryfikować jego działanie. Ukłony dla autora. Korzystanie jest bezpłatne, jednak ponowna publikacja kodu podlega naszym Zasadom serwisu.

Trade smarter, not harder 📡 Strat Radar does the heavy lifting — scanning 50 tickers so you can find setups fast. Try it for free 👉 whop.com/joined/strat-radar
Wyłączenie odpowiedzialności
Informacje i publikacje nie stanowią i nie powinny być traktowane jako porady finansowe, inwestycyjne, tradingowe ani jakiekolwiek inne rekomendacje dostarczane lub zatwierdzone przez TradingView. Więcej informacji znajduje się w Warunkach użytkowania.
Skrypt open-source
W zgodzie z duchem TradingView twórca tego skryptu udostępnił go jako open-source, aby użytkownicy mogli przejrzeć i zweryfikować jego działanie. Ukłony dla autora. Korzystanie jest bezpłatne, jednak ponowna publikacja kodu podlega naszym Zasadom serwisu.
Trade smarter, not harder 📡 Strat Radar does the heavy lifting — scanning 50 tickers so you can find setups fast. Try it for free 👉 whop.com/joined/strat-radar
Wyłączenie odpowiedzialności
Informacje i publikacje nie stanowią i nie powinny być traktowane jako porady finansowe, inwestycyjne, tradingowe ani jakiekolwiek inne rekomendacje dostarczane lub zatwierdzone przez TradingView. Więcej informacji znajduje się w Warunkach użytkowania.