OPEN-SOURCE SCRIPT
nifty vwap 3
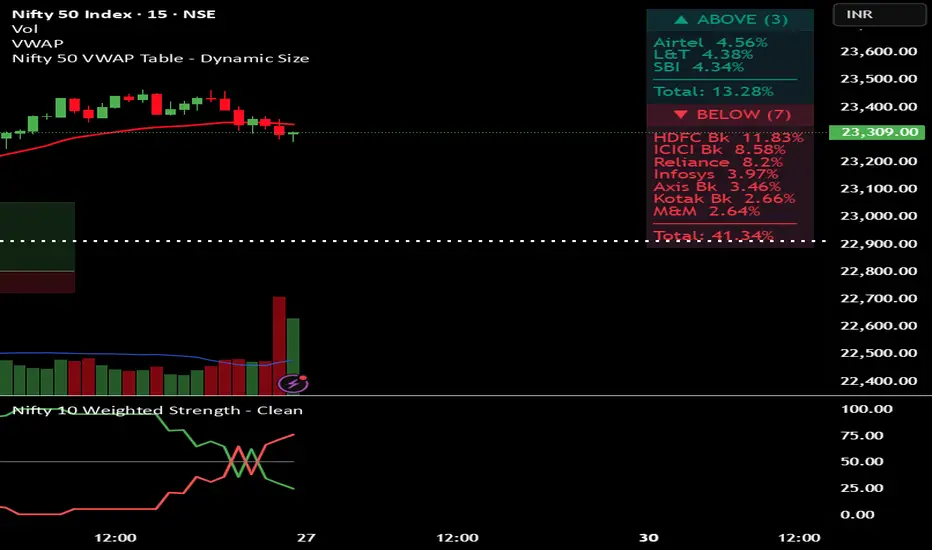
Monitors the "Big Players"
It tracks the 10 most important stocks (like HDFC Bank, Reliance, and ICICI Bank) because these stocks carry the most "weight" and usually decide where the Nifty index goes.
2. The VWAP Test (The Filter)
For each stock, the code checks:
Is the current price Above its average price (VWAP)?
Or is it Below its average price?
Why? If a stock is above VWAP, it is considered Strong (buyers are in control). If it is below, it is Weak (sellers are in control).
3. Calculates "Power" (Weightage)
Instead of just counting stocks, it calculates their combined percentage in the Nifty.
Example: If only 3 stocks are "Above VWAP" but they are the biggest ones (like HDFC and Reliance), the "Total Weight" might still be very high (e.g., 30%), suggesting the market has underlying strength despite fewer stocks being green.
4. Visual Table
It puts all this info into a neat Table on the top-right of your chart.
Teal Section: Shows stocks that are Strong/Bullish.
Red Section: Shows stocks that are Weak/Bearish.
Summary: It tells you exactly how many stocks are on each side and their total percentage impact.
It tracks the 10 most important stocks (like HDFC Bank, Reliance, and ICICI Bank) because these stocks carry the most "weight" and usually decide where the Nifty index goes.
2. The VWAP Test (The Filter)
For each stock, the code checks:
Is the current price Above its average price (VWAP)?
Or is it Below its average price?
Why? If a stock is above VWAP, it is considered Strong (buyers are in control). If it is below, it is Weak (sellers are in control).
3. Calculates "Power" (Weightage)
Instead of just counting stocks, it calculates their combined percentage in the Nifty.
Example: If only 3 stocks are "Above VWAP" but they are the biggest ones (like HDFC and Reliance), the "Total Weight" might still be very high (e.g., 30%), suggesting the market has underlying strength despite fewer stocks being green.
4. Visual Table
It puts all this info into a neat Table on the top-right of your chart.
Teal Section: Shows stocks that are Strong/Bullish.
Red Section: Shows stocks that are Weak/Bearish.
Summary: It tells you exactly how many stocks are on each side and their total percentage impact.
Skrypt open-source
W zgodzie z duchem TradingView twórca tego skryptu udostępnił go jako open-source, aby użytkownicy mogli przejrzeć i zweryfikować jego działanie. Ukłony dla autora. Korzystanie jest bezpłatne, jednak ponowna publikacja kodu podlega naszym Zasadom serwisu.

Wyłączenie odpowiedzialności
Informacje i publikacje nie stanowią i nie powinny być traktowane jako porady finansowe, inwestycyjne, tradingowe ani jakiekolwiek inne rekomendacje dostarczane lub zatwierdzone przez TradingView. Więcej informacji znajduje się w Warunkach użytkowania.
Skrypt open-source
W zgodzie z duchem TradingView twórca tego skryptu udostępnił go jako open-source, aby użytkownicy mogli przejrzeć i zweryfikować jego działanie. Ukłony dla autora. Korzystanie jest bezpłatne, jednak ponowna publikacja kodu podlega naszym Zasadom serwisu.
Wyłączenie odpowiedzialności
Informacje i publikacje nie stanowią i nie powinny być traktowane jako porady finansowe, inwestycyjne, tradingowe ani jakiekolwiek inne rekomendacje dostarczane lub zatwierdzone przez TradingView. Więcej informacji znajduje się w Warunkach użytkowania.