FVG MTF - Open Gaps with 50% Tracking
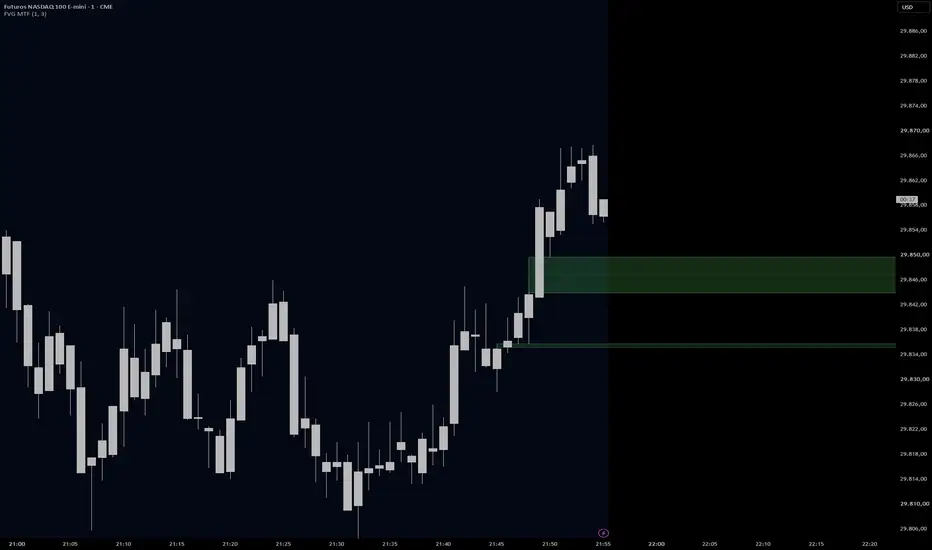
FVG MTF draws Fair Value Gaps (three-candle imbalances) from a chosen timeframe on the current chart and tracks each gap until it is filled.
HOW IT WORKS
• Bullish FVG: the low of the 3rd candle is above the high of the 1st candle.
• Bearish FVG: the high of the 3rd candle is below the low of the 1st candle.
• Only confirmed gaps are drawn: the candle of the selected timeframe must be closed, so gaps do not repaint.
• Shows the N most recent open gaps on each side, from the candle where they formed up to the current bar.
• Each gap changes state as price interacts with it:
- touched: the box turns lighter;
- 50% of the gap reached: the dotted midline becomes solid and highlighted;
- filled (a close beyond the whole gap): the gap is removed.
• If the selected timeframe is lower than the chart timeframe, the chart timeframe is used.
• Options to extend the boxes to the right and/or left, and editable colors.
HOW TO USE
Use open gaps as areas where price moved with imbalance and may react on a return. The touched and 50% states show how deep the return went, which helps separate a shallow test from a full rebalance. A common setup is to read M5 gaps on an M1 chart.
It works well alongside Sigma Map, which draws volatility-based levels from the session open: a gap forming near a sigma level gives two independent references in the same area.
Alerts are available for new bullish and new bearish gaps.
LIMITATIONS
• A gap is a reference area, not a signal.
• "Filled" is judged by the close of the chart bar, so a wick through the gap does not remove it.
• On very low timeframes, many small gaps can appear; increase the FVG timeframe or reduce the number of gaps per side.
HOW IT WORKS
• Bullish FVG: the low of the 3rd candle is above the high of the 1st candle.
• Bearish FVG: the high of the 3rd candle is below the low of the 1st candle.
• Only confirmed gaps are drawn: the candle of the selected timeframe must be closed, so gaps do not repaint.
• Shows the N most recent open gaps on each side, from the candle where they formed up to the current bar.
• Each gap changes state as price interacts with it:
- touched: the box turns lighter;
- 50% of the gap reached: the dotted midline becomes solid and highlighted;
- filled (a close beyond the whole gap): the gap is removed.
• If the selected timeframe is lower than the chart timeframe, the chart timeframe is used.
• Options to extend the boxes to the right and/or left, and editable colors.
HOW TO USE
Use open gaps as areas where price moved with imbalance and may react on a return. The touched and 50% states show how deep the return went, which helps separate a shallow test from a full rebalance. A common setup is to read M5 gaps on an M1 chart.
It works well alongside Sigma Map, which draws volatility-based levels from the session open: a gap forming near a sigma level gives two independent references in the same area.
Alerts are available for new bullish and new bearish gaps.
LIMITATIONS
• A gap is a reference area, not a signal.
• "Filled" is judged by the close of the chart bar, so a wick through the gap does not remove it.
• On very low timeframes, many small gaps can appear; increase the FVG timeframe or reduce the number of gaps per side.

Wyłączenie odpowiedzialności
Informacje i publikacje nie stanowią i nie powinny być traktowane jako porady finansowe, inwestycyjne, tradingowe ani jakiekolwiek inne rekomendacje dostarczane lub zatwierdzone przez TradingView. Więcej informacji znajduje się w Warunkach użytkowania.
Wyłączenie odpowiedzialności
Informacje i publikacje nie stanowią i nie powinny być traktowane jako porady finansowe, inwestycyjne, tradingowe ani jakiekolwiek inne rekomendacje dostarczane lub zatwierdzone przez TradingView. Więcej informacji znajduje się w Warunkach użytkowania.