Trade Planner Buy Sell Signals, Stop Loss, TP [LunqFX]
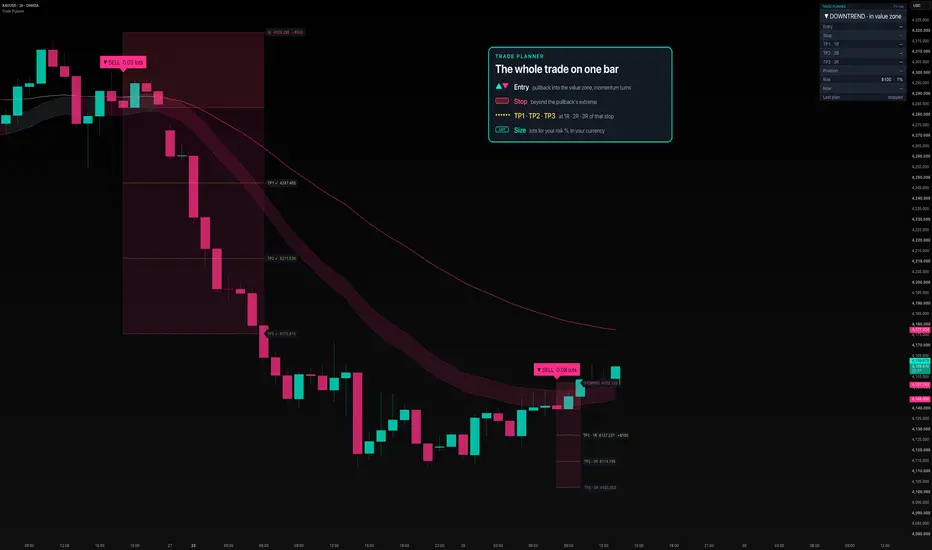
Trade Planner prints buy and sell signals with the stop loss, three take-profit targets and the lot size for your account — all on the bar the setup confirms. Works on forex, gold (XAUUSD), indices and crypto, on intraday charts.
A signal is half a trade. The other half — where the stop goes, where the targets sit, and how large the position must be so the stop costs exactly what you decided to risk — is usually worked out by hand after the arrow appears, while price keeps moving. This tool does that half on the same bar — and converts the size into your account currency, so the stop costs exactly your risk percentage.
The setup itself is deliberately simple and fully described below: trade with the trend, wait for price to pull back into the value zone around the fast moving average, and enter when momentum turns back in the trend's direction. The originality is not in the moving averages or the RSI — both are standard, and they are named plainly — but in turning a pullback into a complete, sized trade plan on one bar, and in tracking that plan until it resolves.
Included: trend and value-zone logic, entry signals, a stop built from the pullback's own extreme, three targets in R multiples, automatic position size in lots, units or contracts, optional stop-to-entry after the first target, a plan panel, and alerts that carry the full plan.
❶ THE SETUP
Trend. The trend is up while the fast EMA is above the slow EMA, price holds above the slow EMA and the slow EMA is not falling. Down is the mirror. When neither holds, the market is treated as having no trend and no plan is printed.
Value zone. A band around the fast EMA, its width a fraction of ATR. It is drawn on the chart and tinted by the trend. A pullback counts once price trades into it while the trend is intact.
Trigger. After a pullback, the plan is printed on the first closed bar that closes back beyond the fast EMA in the trend's direction, closes in that direction itself, and has RSI on the trend's side of 50 and rising (falling, for shorts). The RSI here does one job: confirm that momentum has turned back with the trend, so the plan is not printed while the pullback is still running.
❷ THE PLAN
Entry — the close of the trigger bar. Stop — beyond the lowest low (highest high, for shorts) of the last few bars — the pullback itself, not an older swing — plus an ATR buffer. If that stop would be tighter than a minimum distance in ATR it is widened to the minimum, so one noisy candle does not end the trade. If it would be wider than a maximum distance in ATR, the setup is skipped and no plan is printed: a stop five ATR away is not a pullback trade any more. Targets — TP1, TP2 and TP3 at 1R, 2R and 3R of that stop by default, each adjustable. They are drawn as gold dotted lines with price tags; the risk and reward are shaded as two zones.
❸ POSITION SIZE
Risk money is your balance times your risk percentage. The size is that amount divided by what one unit of the instrument loses over the stop distance — using the symbol's point value and converting from the symbol's currency into your account currency. The result is shown in lots for forex (100,000 units), gold (100 oz) and silver (5,000 oz), in contracts for futures, and in units for everything else. If your broker uses a different lot size, it can be entered directly.
The entry label shows the size, the stop tag shows what the stop costs, and the TP1 tag shows what the first target is worth at that size.
❹ TRACKING THE PLAN
A plan stays open until the stop or TP3 is reached, or — optionally — until an opposite plan appears. Targets reached along the way are ticked on their tags. If one bar touches both the stop and a target, it is counted as the stop: the order of fills inside a bar is unknown, and the honest reading is the loss. Optionally the stop moves to the entry after TP1. The panel shows the open plan, where price stands in R right now, and how the previous plan ended.
HOW TO USE IT
1 — Set your balance, risk percentage and account currency first. The size is only as right as these numbers.
2 — Read the panel before the arrow. "Uptrend · waiting for pullback" means there is nothing to do yet. "In value zone" means a plan may print on the next bars.
3 — Check the size against your broker. The script calculates it from TradingView's symbol data; your broker's contract size or margin rules can differ.
4 — Decide what you do at TP1. The plan gives three targets; whether you scale out, move the stop or hold is yours. With the stop-to-entry option on, the chart tracks the plan with the stop moved to the entry after TP1, and a return to the entry closes the plan as "exit at entry". The script places no orders either way.
5 — Use it on liquid instruments on intraday charts, where pullbacks to a moving average are frequent and spreads are small relative to the stop.
HOW IT WORKS
Two exponential moving averages define the trend, an ATR-scaled band around the fast one defines the value zone, and RSI confirms the turn. The lowest low (or highest high) of a short recent window becomes the anchor for the stop, and a stop outside the allowed ATR range either widens to the minimum or cancels the setup. Targets are multiples of the resulting stop distance. The position size divides the risk money by the stop distance times the symbol's point value, converted with TradingView's currency-rate data. Every decision — trend state, pullback, trigger, target hits and stop hits — is made on closed bars only.
LIMITATIONS — read before relying on it
▸ It is a trend-pullback method. In a range the trend condition switches on and off and plans are printed into chop. The "no trend" state in the panel is the warning; there is no filter that removes ranging markets completely.
▸ The stop is placed by structure, not by your preference. On a deep pullback it can be wide, and the size shrinks to keep the risk constant. Setups whose stop exceeds the maximum ATR distance are skipped, so a strong trend with deep pullbacks can print fewer plans than you expect.
▸ Position size is an estimate from TradingView's data. Broker contract sizes, account currency conversions, commissions, spreads and minimum lot steps are not known to the script. Check the number before using it.
▸ Targets are fixed multiples of the stop. They do not look at the next level of support or resistance, which may sit before TP1.
▸ When one bar spans both the stop and a target, the plan is recorded as stopped. On fast markets and higher timeframes this is conservative by design.
▸ The ticks on reached targets and the "last plan" line describe individual plans. They are not collected into a win rate, and nothing here is a statement about future results.
▸ Signals appear on the close of the trigger bar. Between that close and your order, price can already have moved.
▸ On one- and five-minute charts the stop can be only a few pips, and the spread then takes a large share of it — the size grows to match. Raise the minimum stop distance if you trade those timeframes.
WHY IT IS ORIGINAL
Pullback entries and R-multiple targets are common ideas, and this description does not pretend otherwise. What this script adds is the step most signal tools leave to the trader: it anchors the stop on the pullback's own extreme, derives three targets from it, and sizes the position for the account in its own currency — on the same bar, as one plan — and then follows that plan to its end on the chart.
It is also not a version of my other scripts. Adaptive SuperTrend and Trend Trail are trailing-stop trend tools with no entry plan and no sizing. The Position Size Calculator sizes levels you place by hand; it does not find setups. Trade Planner finds the setup and builds the sized plan itself.
SETTINGS
▸ Account & risk — balance, risk %, account currency, units per lot. ▸ Setup — fast EMA, slow EMA, RSI length, value-zone width, stop buffer, minimum and maximum stop distance, pullback lookback. ▸ Targets & management — TP1, TP2, TP3 in R, stop to entry after TP1, close on opposite signal. ▸ Visuals — five candle palettes plus off, value zone, size of the level tags and entry label, number of plans kept on the chart, panel position and text size.
ALERTS — buy plan and sell plan (the message carries entry, stop, all three targets and the size), target reached, stop reached. Create them as "Any alert() function call", or use the four classic alert conditions.
NON-REPAINTING — every signal, stop, target and hit is decided on a closed bar. A printed plan never moves.
This indicator is an educational tool for planning trades and sizing risk. It is not financial advice and it does not predict price. Always confirm with your own analysis and manage your risk.
A signal is half a trade. The other half — where the stop goes, where the targets sit, and how large the position must be so the stop costs exactly what you decided to risk — is usually worked out by hand after the arrow appears, while price keeps moving. This tool does that half on the same bar — and converts the size into your account currency, so the stop costs exactly your risk percentage.
The setup itself is deliberately simple and fully described below: trade with the trend, wait for price to pull back into the value zone around the fast moving average, and enter when momentum turns back in the trend's direction. The originality is not in the moving averages or the RSI — both are standard, and they are named plainly — but in turning a pullback into a complete, sized trade plan on one bar, and in tracking that plan until it resolves.
Included: trend and value-zone logic, entry signals, a stop built from the pullback's own extreme, three targets in R multiples, automatic position size in lots, units or contracts, optional stop-to-entry after the first target, a plan panel, and alerts that carry the full plan.
❶ THE SETUP
Trend. The trend is up while the fast EMA is above the slow EMA, price holds above the slow EMA and the slow EMA is not falling. Down is the mirror. When neither holds, the market is treated as having no trend and no plan is printed.
Value zone. A band around the fast EMA, its width a fraction of ATR. It is drawn on the chart and tinted by the trend. A pullback counts once price trades into it while the trend is intact.
Trigger. After a pullback, the plan is printed on the first closed bar that closes back beyond the fast EMA in the trend's direction, closes in that direction itself, and has RSI on the trend's side of 50 and rising (falling, for shorts). The RSI here does one job: confirm that momentum has turned back with the trend, so the plan is not printed while the pullback is still running.
❷ THE PLAN
Entry — the close of the trigger bar. Stop — beyond the lowest low (highest high, for shorts) of the last few bars — the pullback itself, not an older swing — plus an ATR buffer. If that stop would be tighter than a minimum distance in ATR it is widened to the minimum, so one noisy candle does not end the trade. If it would be wider than a maximum distance in ATR, the setup is skipped and no plan is printed: a stop five ATR away is not a pullback trade any more. Targets — TP1, TP2 and TP3 at 1R, 2R and 3R of that stop by default, each adjustable. They are drawn as gold dotted lines with price tags; the risk and reward are shaded as two zones.
❸ POSITION SIZE
Risk money is your balance times your risk percentage. The size is that amount divided by what one unit of the instrument loses over the stop distance — using the symbol's point value and converting from the symbol's currency into your account currency. The result is shown in lots for forex (100,000 units), gold (100 oz) and silver (5,000 oz), in contracts for futures, and in units for everything else. If your broker uses a different lot size, it can be entered directly.
The entry label shows the size, the stop tag shows what the stop costs, and the TP1 tag shows what the first target is worth at that size.
❹ TRACKING THE PLAN
A plan stays open until the stop or TP3 is reached, or — optionally — until an opposite plan appears. Targets reached along the way are ticked on their tags. If one bar touches both the stop and a target, it is counted as the stop: the order of fills inside a bar is unknown, and the honest reading is the loss. Optionally the stop moves to the entry after TP1. The panel shows the open plan, where price stands in R right now, and how the previous plan ended.
HOW TO USE IT
1 — Set your balance, risk percentage and account currency first. The size is only as right as these numbers.
2 — Read the panel before the arrow. "Uptrend · waiting for pullback" means there is nothing to do yet. "In value zone" means a plan may print on the next bars.
3 — Check the size against your broker. The script calculates it from TradingView's symbol data; your broker's contract size or margin rules can differ.
4 — Decide what you do at TP1. The plan gives three targets; whether you scale out, move the stop or hold is yours. With the stop-to-entry option on, the chart tracks the plan with the stop moved to the entry after TP1, and a return to the entry closes the plan as "exit at entry". The script places no orders either way.
5 — Use it on liquid instruments on intraday charts, where pullbacks to a moving average are frequent and spreads are small relative to the stop.
HOW IT WORKS
Two exponential moving averages define the trend, an ATR-scaled band around the fast one defines the value zone, and RSI confirms the turn. The lowest low (or highest high) of a short recent window becomes the anchor for the stop, and a stop outside the allowed ATR range either widens to the minimum or cancels the setup. Targets are multiples of the resulting stop distance. The position size divides the risk money by the stop distance times the symbol's point value, converted with TradingView's currency-rate data. Every decision — trend state, pullback, trigger, target hits and stop hits — is made on closed bars only.
LIMITATIONS — read before relying on it
▸ It is a trend-pullback method. In a range the trend condition switches on and off and plans are printed into chop. The "no trend" state in the panel is the warning; there is no filter that removes ranging markets completely.
▸ The stop is placed by structure, not by your preference. On a deep pullback it can be wide, and the size shrinks to keep the risk constant. Setups whose stop exceeds the maximum ATR distance are skipped, so a strong trend with deep pullbacks can print fewer plans than you expect.
▸ Position size is an estimate from TradingView's data. Broker contract sizes, account currency conversions, commissions, spreads and minimum lot steps are not known to the script. Check the number before using it.
▸ Targets are fixed multiples of the stop. They do not look at the next level of support or resistance, which may sit before TP1.
▸ When one bar spans both the stop and a target, the plan is recorded as stopped. On fast markets and higher timeframes this is conservative by design.
▸ The ticks on reached targets and the "last plan" line describe individual plans. They are not collected into a win rate, and nothing here is a statement about future results.
▸ Signals appear on the close of the trigger bar. Between that close and your order, price can already have moved.
▸ On one- and five-minute charts the stop can be only a few pips, and the spread then takes a large share of it — the size grows to match. Raise the minimum stop distance if you trade those timeframes.
WHY IT IS ORIGINAL
Pullback entries and R-multiple targets are common ideas, and this description does not pretend otherwise. What this script adds is the step most signal tools leave to the trader: it anchors the stop on the pullback's own extreme, derives three targets from it, and sizes the position for the account in its own currency — on the same bar, as one plan — and then follows that plan to its end on the chart.
It is also not a version of my other scripts. Adaptive SuperTrend and Trend Trail are trailing-stop trend tools with no entry plan and no sizing. The Position Size Calculator sizes levels you place by hand; it does not find setups. Trade Planner finds the setup and builds the sized plan itself.
SETTINGS
▸ Account & risk — balance, risk %, account currency, units per lot. ▸ Setup — fast EMA, slow EMA, RSI length, value-zone width, stop buffer, minimum and maximum stop distance, pullback lookback. ▸ Targets & management — TP1, TP2, TP3 in R, stop to entry after TP1, close on opposite signal. ▸ Visuals — five candle palettes plus off, value zone, size of the level tags and entry label, number of plans kept on the chart, panel position and text size.
ALERTS — buy plan and sell plan (the message carries entry, stop, all three targets and the size), target reached, stop reached. Create them as "Any alert() function call", or use the four classic alert conditions.
NON-REPAINTING — every signal, stop, target and hit is decided on a closed bar. A printed plan never moves.
This indicator is an educational tool for planning trades and sizing risk. It is not financial advice and it does not predict price. Always confirm with your own analysis and manage your risk.

Trade setups with clear entry, stop, target and risk logic. Built for traders who want structure, not guessing.
💬 t.me/lunqfx
🌐 lunqfx.com/premium
💬 t.me/lunqfx
🌐 lunqfx.com/premium
Wyłączenie odpowiedzialności
Informacje i publikacje nie stanowią i nie powinny być traktowane jako porady finansowe, inwestycyjne, tradingowe ani jakiekolwiek inne rekomendacje dostarczane lub zatwierdzone przez TradingView. Więcej informacji znajduje się w Warunkach użytkowania.
Trade setups with clear entry, stop, target and risk logic. Built for traders who want structure, not guessing.
💬 t.me/lunqfx
🌐 lunqfx.com/premium
💬 t.me/lunqfx
🌐 lunqfx.com/premium
Wyłączenie odpowiedzialności
Informacje i publikacje nie stanowią i nie powinny być traktowane jako porady finansowe, inwestycyjne, tradingowe ani jakiekolwiek inne rekomendacje dostarczane lub zatwierdzone przez TradingView. Więcej informacji znajduje się w Warunkach użytkowania.