Zaktualizowano
VWAP-MACD with Volume Confirmation
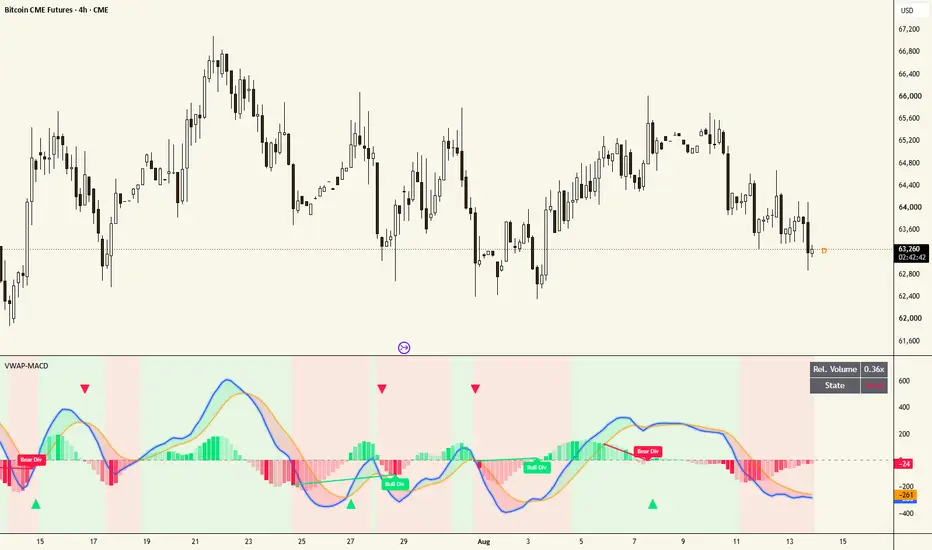
VWAP-MACD with Volume Confirmation
VWAP-MACD+ replaces the price series inside a classic MACD calculation with an anchored VWAP series, then adds a volume-strength filter so that crossover signals are only flagged as "confirmed" when they occur on above-average volume. The result is a momentum oscillator that reflects shifts in the volume-weighted average price rather than raw closing price, with a built-in sanity check against low-conviction crosses.
How it works
Anchored VWAP — VWAP is calculated from hlc3 * volume, accumulated and reset at the start of each new period based on the selected anchor (Session, Week, or Month). This is the same anchoring logic as TradingView's native VWAP, just computed manually so it can feed into the MACD below.
VWAP-based MACD — instead of EMA-ing close like a standard MACD, this script EMAs the VWAP series itself (fast length default 12, slow length default 26). The difference between the fast and slow EMAs of VWAP is the MACD line; a further EMA of that (default 9) is the signal line; their difference is the histogram. Because VWAP is smoother and volume-weighted, the resulting MACD reacts to shifts in the "fair value" price rather than every tick of noise in the close.
Volume Momentum Filter — each bar's volume is compared to its moving average (default 20-period SMA) to get a relative volume ratio. Bars are classified as strong (≥1.5x average), weak (<0.75x average), or normal, and the histogram's color intensity reflects this — brighter columns mean the current move is backed by stronger volume, faded columns mean it's on thin volume.
Volume-Confirmed Crossovers — a standard MACD/signal-line crossover only becomes a plotted "confirmed" signal when relative volume is at or above average (≥1.0x). This is meant to filter out crossovers that happen on quiet, low-conviction bars.
Reading the indicator
Blue line — VWAP-based MACD line.
Orange line — signal line (EMA of the MACD line).
Histogram columns — MACD minus signal, colored green above zero / red below zero, with intensity scaled by relative volume (bright = strong volume, faded = weak volume, mid = normal).
Green up-triangle — bullish crossover confirmed by volume.
Red down-triangle — bearish crossover confirmed by volume.
Zero line — dashed gray reference; crosses of the MACD line through zero can also be used as a secondary trend-context read, though this script's plotted signals are specifically the signal-line crossovers.
Suggested use
This is a trend/momentum tool built around volume-weighted price rather than raw close, intended for:
Traders who already use VWAP as an intraday or swing fair-value reference and want a momentum oscillator derived from that same series instead of close price
Filtering out MACD crossovers that occur on low-volume, low-conviction bars by relying on the "confirmed" triangle markers rather than every raw crossover
Combining with the anchor period that matches your trading horizon — Session for intraday, Week or Month for swing/position context
As with any momentum oscillator, it works best alongside broader trend or structure context (e.g., higher-timeframe trend, support/resistance) rather than as a standalone signal — volume confirmation reduces noise but doesn't guarantee follow-through.
Inputs
Fast Length / Slow Length / Signal Smoothing — EMA lengths for the VWAP-MACD calculation
VWAP Anchor Period — Session, Week, or Month
Volume MA Lookback — averaging period for the relative volume filter
Enable Volume Confirmation Shading — toggles both the histogram's volume-based color intensity and the volume requirement on confirmed crossover signals
Alerts
Two alert conditions are built in:
VWAP-MACD Bullish Cross (Vol Confirmed)
VWAP-MACD Bearish Cross (Vol Confirmed)
VWAP-MACD+ replaces the price series inside a classic MACD calculation with an anchored VWAP series, then adds a volume-strength filter so that crossover signals are only flagged as "confirmed" when they occur on above-average volume. The result is a momentum oscillator that reflects shifts in the volume-weighted average price rather than raw closing price, with a built-in sanity check against low-conviction crosses.
How it works
Anchored VWAP — VWAP is calculated from hlc3 * volume, accumulated and reset at the start of each new period based on the selected anchor (Session, Week, or Month). This is the same anchoring logic as TradingView's native VWAP, just computed manually so it can feed into the MACD below.
VWAP-based MACD — instead of EMA-ing close like a standard MACD, this script EMAs the VWAP series itself (fast length default 12, slow length default 26). The difference between the fast and slow EMAs of VWAP is the MACD line; a further EMA of that (default 9) is the signal line; their difference is the histogram. Because VWAP is smoother and volume-weighted, the resulting MACD reacts to shifts in the "fair value" price rather than every tick of noise in the close.
Volume Momentum Filter — each bar's volume is compared to its moving average (default 20-period SMA) to get a relative volume ratio. Bars are classified as strong (≥1.5x average), weak (<0.75x average), or normal, and the histogram's color intensity reflects this — brighter columns mean the current move is backed by stronger volume, faded columns mean it's on thin volume.
Volume-Confirmed Crossovers — a standard MACD/signal-line crossover only becomes a plotted "confirmed" signal when relative volume is at or above average (≥1.0x). This is meant to filter out crossovers that happen on quiet, low-conviction bars.
Reading the indicator
Blue line — VWAP-based MACD line.
Orange line — signal line (EMA of the MACD line).
Histogram columns — MACD minus signal, colored green above zero / red below zero, with intensity scaled by relative volume (bright = strong volume, faded = weak volume, mid = normal).
Green up-triangle — bullish crossover confirmed by volume.
Red down-triangle — bearish crossover confirmed by volume.
Zero line — dashed gray reference; crosses of the MACD line through zero can also be used as a secondary trend-context read, though this script's plotted signals are specifically the signal-line crossovers.
Suggested use
This is a trend/momentum tool built around volume-weighted price rather than raw close, intended for:
Traders who already use VWAP as an intraday or swing fair-value reference and want a momentum oscillator derived from that same series instead of close price
Filtering out MACD crossovers that occur on low-volume, low-conviction bars by relying on the "confirmed" triangle markers rather than every raw crossover
Combining with the anchor period that matches your trading horizon — Session for intraday, Week or Month for swing/position context
As with any momentum oscillator, it works best alongside broader trend or structure context (e.g., higher-timeframe trend, support/resistance) rather than as a standalone signal — volume confirmation reduces noise but doesn't guarantee follow-through.
Inputs
Fast Length / Slow Length / Signal Smoothing — EMA lengths for the VWAP-MACD calculation
VWAP Anchor Period — Session, Week, or Month
Volume MA Lookback — averaging period for the relative volume filter
Enable Volume Confirmation Shading — toggles both the histogram's volume-based color intensity and the volume requirement on confirmed crossover signals
Alerts
Two alert conditions are built in:
VWAP-MACD Bullish Cross (Vol Confirmed)
VWAP-MACD Bearish Cross (Vol Confirmed)
Informacje o Wersji
What's new in this versionStyle
Full color customization for the MACD line, signal line, and bullish/bearish tones
Optional gradient fill between the MACD and signal lines that flips color depending on which is on top
Optional soft glow behind the MACD/signal lines for better visibility on dark themes
Optional zero-line bias background shading
"Use OG (original) style" toggle — instantly reverts everything to the original flat blue/orange/lime/red look with no fill, glow, or divergence markers, for anyone who prefers the classic version
New features
* Divergence detection: pivot-based bullish/bearish divergence between price and the histogram, drawn as connecting lines plus labels directly on the oscillator pane. These are anchored to exact bar/price coordinates, so they track correctly and rescale properly when you resize or zoom the pane (older marker count is capped automatically to avoid clutter)
* Volume status table: a small on-chart table showing current relative volume and whether it's Strong / Normal / Weak
* All original crossover shapes and alert conditions (bullish/bearish cross, volume-confirmed) are unchanged in behavior
Inputs are grouped into Core, Style, and Improvements for easy navigation in the settings panel.

Wyłączenie odpowiedzialności
Informacje i publikacje nie stanowią i nie powinny być traktowane jako porady finansowe, inwestycyjne, tradingowe ani jakiekolwiek inne rekomendacje dostarczane lub zatwierdzone przez TradingView. Więcej informacji znajduje się w Warunkach użytkowania.
Wyłączenie odpowiedzialności
Informacje i publikacje nie stanowią i nie powinny być traktowane jako porady finansowe, inwestycyjne, tradingowe ani jakiekolwiek inne rekomendacje dostarczane lub zatwierdzone przez TradingView. Więcej informacji znajduje się w Warunkach użytkowania.